


Reviewing the Recent Government Accountability Office Report on MFP 2019
The U.S. Government Accountability Office (GAO) recently released a report that reviewed USDA’s 2019 Market Facilitation Program (MFP) and payments (GAO-20-700R, September 14, 2020; Rappeport, September 14, 2020). USDA has reported that it made $14.495 billion in payments to farmers as of August 31, 2020 (USDA, farmers.gov MFP). This article reviews the GAO report.
Background
In the first quarter of 2018, the Trump Administration implemented tariffs on a variety of imports and trading partners impacted by the tariffs, especially China, retaliated with tariffs on American exports. The ensuing conflict was particularly acute for American soybean exports to China (farmdoc daily, November 21, 2019). The economic impact on farmers and domestic political concerns resulted in USDA creating the Market Facilitation Program (MFP). To create the program, USDA used long-standing general authority under the Commodity Credit Corporation Charter Act of 1948; a new version of MFP was created for 2019. All told, USDA has reported $23.1 billion in direct payments to farmers under the two versions of MFP but the $14.5 billion in 2019 payments have gained the most notice, in large part due to the very obvious regional disparities in payments (farmdoc daily, December 12, 2019; December 19, 2019).
Discussion
The GAO report confirms previous reviews of the 2019 MFP payments. To date, all reviews of the program have concluded that the highest payment rates of $150 per acre were almost exclusively in the South (GAO-20-700R, at Figure 1; Janzen and Hendricks, May 3, 2020). Inequitable farm payments favoring crops only grown in the South is nothing new (CRS Report R4491 at 18-24). The 2019 MFP program and GAO’s report does provide some important perspectives on how it happens, however.
(1) Measuring Parity in 2019 MFP Payments
Too often, reports on federal farm payments fail to look beyond the top line numbers; total payments by state more often obscures than informs. For example, four states received more than $1 billion in 2019 MFP payments and Iowa led the way with nearly $1.5 billion followed by Illinois ($1.4 billion). Importantly, 2019 MFP payments were made on acres planted in the county to a list of non-specialty crops, as well as a $15 per acre payment on those acres that were prevent plant and planted to cover crops. Reviewing payments relative to acres planted provides a much better perspective than state totals; based on planted acres, it is logical that higher acreage states will receive higher total payments. Only three states planted more than 20 million acres of the non-specialty crops in 2019. Iowa again led the way with nearly 22.5 million acres of non-specialty crops planted, followed by North Dakota (21 million) and Illinois (20 million). Another six states planted more than 10 million acres, Kansas (19.9 million), Nebraska (16.9 million), Minnesota (16.7 million), Texas (13.7 million), South Dakota (11 million) and Indiana (10.4 million). Of these states, only Texas has counties receiving the maximum $150 per acre payments. Georgia, for example, had the highest total payments per acres planted at $119.24; nearly $293 million in payments on less than 2.5 million acres planted.
This begs questions about equitable payments that are difficult to answer. One possible measure would be parity based on acres planted to the non-specialty crops using the State’s share of national acres planted to non-specialty crops compared to its share of total MFP 2019 payments for non-specialty crops. Figure 1 illustrates this parity measurement with states above 100% considered above parity.
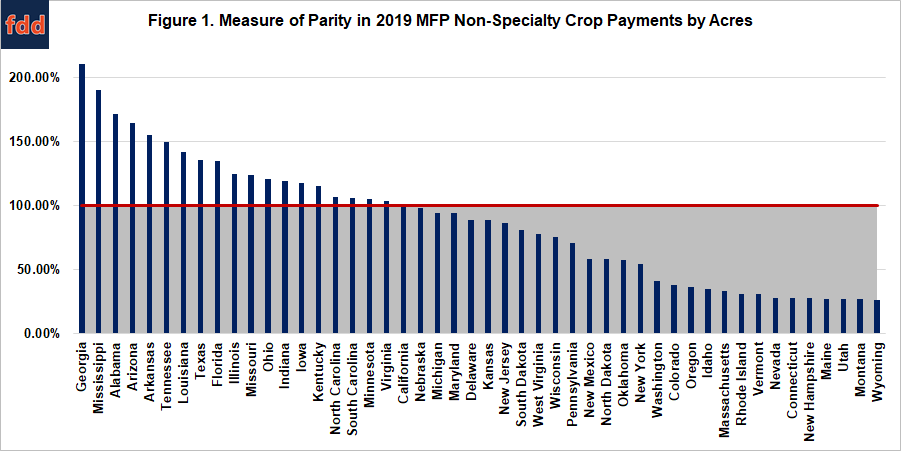
By this measure, Georgia leads the way. Georgia’s share of total non-specialty crop payments is more than 200% of its share of non-specialty crop acres. Mississippi follows at 190%. These states are receiving far more of their share in payments than would be expected by their share of acres in a program making per-acre payments.
(2) The Driver of Differences in Payments
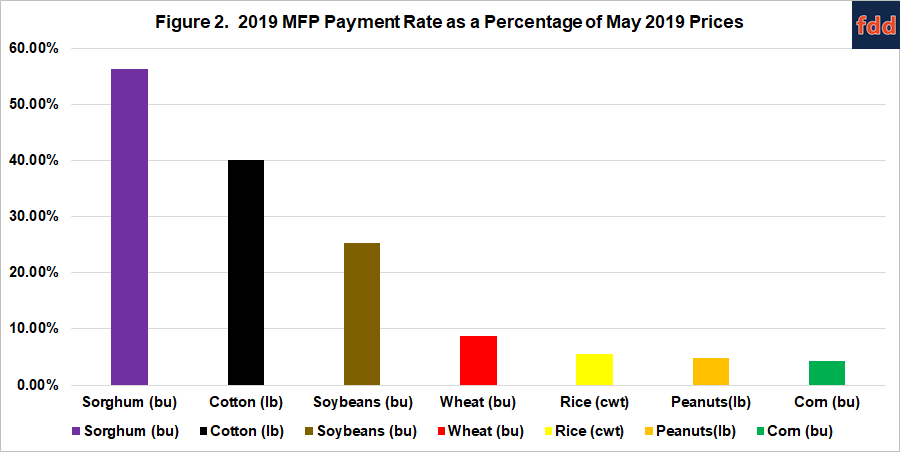
The disparity amongst states in Figure 1 can be understood by comparing the 2019 MFP payment rates by crop to prices. GAO compared the rates to the May 2019 market prices using USDA data. Figure 2 illustrates the 2019 MFP payment rate as a percentage of the May 2019 prices using GAO’s method. Sorghum, cotton and soybeans received by far the highest or most favorable payment rates.
Based on the payment rates, it would stand to reason that those states with more acres in sorghum, cotton and soybeans should receive more in payments. GAO does not provide a breakdown of the acres by non-specialty crop. Figure 3 compares the acres planted to all non-specialty crops by state as reported by NASS based on the percentage that was planted to each of the major non-specialty crops. The states remain ranked as in Figure 1’s measure of parity.
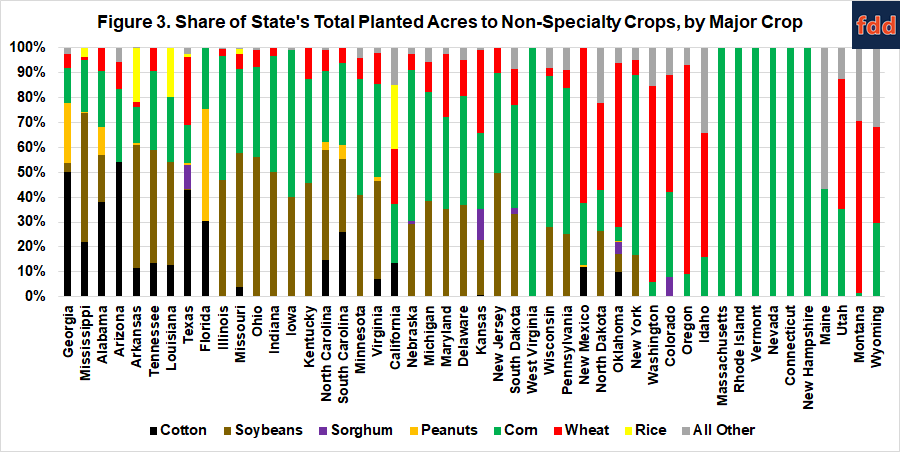
Comparing Figure 3 with Figure 1 helps further explain the disparity in payments. Acres planted to cotton aligns closely with the states at the upper end of the parity measure in Figure 1. Georgia was also helped by having significant acreage in peanuts, while Mississippi benefitted from a large share of acres in soybeans. Neither state had many acres in either corn or wheat, which were on the low end of the payment rates used.
(3) Continuing Questions About the Payment Rates
The GAO report does not answer the question about how the payment rates were determined and this remains the single biggest missing element to understanding the 2019 MFP. In its August 2019 Trade Methodology Report, USDA explained that the commodity rates were derived from estimates of gross trade damage (USDA August 22, 2019). Announced on May 23, 2019, the 2019 MFP program obviously could not have used actual estimates for trade damage in 2019. Reporting at the time indicated that USDA used the highest export level in the years 2009 to 2018 to determine damage (Janzen and Hendricks, May 3, 2020). This is an odd, if not questionable, method for determining trade damage in 2018 or 2019.
Figure 4 compares the 2018 total export value for the major commodities as a percentage of the maximum export value in the years 2009 to 2018, as reported by USDA’s Foreign Agricultural Service (Global Agricultural Trade System). To be clear, this is not likely the exact methodology used by USDA. Janzen and Hendricks looked deeper at the exports from countries that imposed retaliatory tariffs as the measure of damage and, in particular, China (Janzen and Hendricks, May 3, 2020).
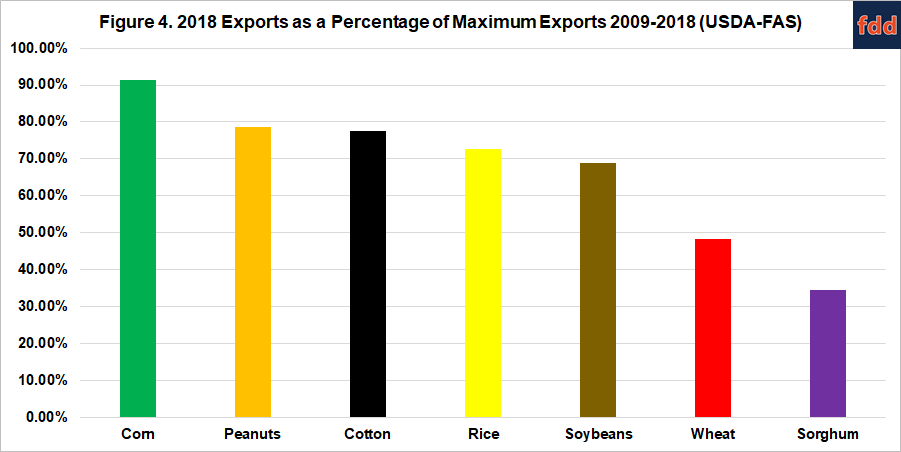
Figure 4 raises more questions for USDA’s methodology than it answers, unfortunately. USDA’s trade damage estimates provided a rate for cotton that was 40% of its May prices but cotton’s 2018 exports were 77.5% of the maximum exports in the ten-year period (2009-2018). Corn’s payment rate was about 4% of its May 2019 price, with its 2018 exports at 91% of its maximum exports in 2009-2018. This methodology also failed to account for cross-commodity price impacts, raising further questions (farmdoc daily, September 25, 2019). USDA would need to provide further clarity about its methodology to clear up the confusion around payment rates.
(4) Further Implications of Favorable Treatment and Disparity
Questions and lack of clarity about the methodology does not obscure the fact that cotton farmers received more favorable treatment than the other commodities included in the 2019 MFP and that resulted in higher payment rates in Southern counties and for southern farmers. State aggregated total payments also present an incomplete picture of the program, however, because a state does not receive the payments, farmers do. It is in this that favoritism and disparity translate into real impacts on the ground, of which the GAO report also provides evidence.
Figure 5 illustrates the top 25 farm operations ranked by total 2019 MFP payments received, according to the GAO report. GAO did not name the operations but provided a regional designation. All 25 farms received more than $1 million and 15 of the 25 (60%) were in the South, while another three (12%) were in the South and Midwest. The remaining seven farms (28%) were in the Midwest. All of these farm operations had multiple members in the farm operation that qualified for payments (yellow dots).
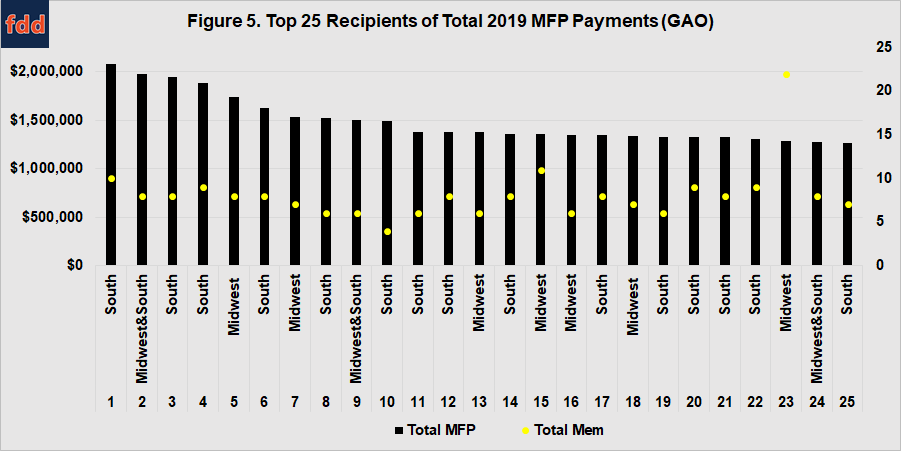
Like all farm program payments, USDA required that 2019 MFP payments be directly attributed to an individual. USDA announced that no person or legal entity may receive more than $250,000 per person or entity, which was higher than the $125,000 payment limit for current farm bill programs (e.g., ARC and PLC). Figure 5 also provides an information for how some farms use the entity structure to avoid the limits.
In general, the method for maximizing a farm’s payments is to either add family members to the operation or use an entity structure (corporation, LLC, general partnership or joint venture) and increase the number of members in the entity. This can allow a farm to collect millions in total payments without running afoul of the payment limit. Figure 6 illustrates the results of this method with the average payment per member in each of the Top 25 farms reported by GAO (red line is the $250,000 payment limit). Only two of the farms (#8 and #10, both from the South) averaged payments per member above the $250,000 limit. The lowest per member average was the Midwestern farm (#23) with the highest number of members (22) but it is notable that this farm received payments only for dairy and hogs, rather than non-specialty crops.

Figure 6 highlights further disparities in payments. GAO reported that payments per individual ranged from $4 to $295,299 nationally. GAO also mapped those payments by operation by county (GAO-20-700R, at Figure 2, page 21). For the 48 contiguous states in the U.S., GAO reported that a total of 870,039 individuals received a total of $14.4 billion in 2019 MFP payments; the count was for all payments, not just those for the non-specialty crops and is a national average of $16,513 per individual. The top 25 farms receiving payments not only received more than $1 million each, but the average of the payments per members in those farms was $200,334.
A reminder that payments go to individuals, not states and raise the question as to whether a review of individuals receiving payments alters the measure of parity. Figure 7 illustrates this parity measurement based on GAO’s data on individuals receiving payments. In Figure 7, the state share of total individuals receiving payments is compared to the state share of total MFP payments, as a percentage. At 100%, the state’s share of payments would equal its share of individuals receiving payments; states above that received more in payments than its share of individuals receiving payments.

Georgia and Mississippi are again the top states by this measure. The $311 million in total MFP payments made in Georgia were made to only 7,306 individuals (averaged $42,545 per individual), or 258% of its share of total individuals receiving payments. Mississippi also received total payments more than double its share of recipients (215%).
Concluding Thoughts
The recent GAO report provides important perspectives and analysis of the Trump Administration’s Market Facilitation Program payments in 2019. The report highlights the ways in which a questionable methodology for calculating trade damage translated into substantial disparities in payments. Georgia and Mississippi both received a share of MFP payments that were more than double their share of acres upon which payments were made and share of individuals receiving payments. These disparities in federal assistance are often missed when aggregate state payments are reported. Also lost in the numbers are the differences among actual farmers. Twenty-five farms received more than $1 million in 2019 MFP payments and the average payment per member of those farms was over $200,000; most of these farms were also cotton farms in southern states. The onus remains on USDA to explain fully the disparities amongst crops, farmers and states.
References
Coppess, J., G. Schnitkey, C. Zulauf and K. Swanson. "The Market Facilitation Program: A New Direction in Public Agricultural Policy?." farmdoc daily (9):220, Department of Agricultural and Consumer Economics, University of Illinois at Urbana-Champaign, November 21, 2019.
Janzen, J. and N. Hendricks. “Are Farmers Made Whole by Trade Aid?” Applied Economic Perspectives and Policy 42(2020): 205-226. doi:10.1002/aepp.13045.
Paulson, N., J. Coppess, G. Schnitkey, K. Swanson and C. Zulauf. "Mapping the Market Facilitation Program." farmdoc daily (9):232, Department of Agricultural and Consumer Economics, University of Illinois at Urbana-Champaign, December 12, 2019.
Paulson, N., J. Coppess, G. Schnitkey, K. Swanson and C. Zulauf. "Mapping the Market Facilitation Program: Part 2." farmdoc daily (9):236, Department of Agricultural and Consumer Economics, University of Illinois at Urbana-Champaign, December 19, 2019.
Rappeport, Alan. “Independent Watchdog Report Finds Inequity in Farm Aid Payments.” New York Times, September 14, 2020, accessed October 8, 2020. https://www.nytimes.com/2020/09/14/us/politics/trump-farm-aid-gao.html
U.S. Department of Agriculture, Office of the Chief Economist. “Trade Damage Estimation for the 2019 Market Facilitation Program and Food Purchase and Distribution Program.” August 22, 2019. https://www.usda.gov/sites/default/files/documents/USDA_Trade_Methodology_Report_2019.pdf
U.S. Department of Agriculture. Market Facilitation Program. farmers.gov. Accessed October 8, 2020. https://www.farmers.gov/manage/mfp
U.S. Government Accountability Office. “USDA Market Facilitation Program: Information on Payments for 2019.” GAO-20-700R. Publicly released September 14, 2020, accessed October 8, 2020. https://www.gao.gov/products/GAO-20-700R
Zulauf, C., K. Swanson, G. Schnitkey, J. Coppess and N. Paulson. "Assessing Market Facilitation Payments in Hindsight and Implications for Future Policy." farmdoc daily (9):179, Department of Agricultural and Consumer Economics, University of Illinois at Urbana-Champaign, September 25, 2019.
Disclaimer: We request all readers, electronic media and others follow our citation guidelines when re-posting articles from farmdoc daily. Guidelines are available here. The farmdoc daily website falls under University of Illinois copyright and intellectual property rights. For a detailed statement, please see the University of Illinois Copyright Information and Policies here.