China’s Corn Sector
China’s corn imports have been a topic of intense speculation since the mid-1990s. China is forecast to import a historical high of 512 million bushels during the 2020 crop year, prompting the question: “Will China become a consistent, growing importer of corn?” Perspective on this question is provided by examining trends in China’s corn sector since the early 1970s using US Department of Agriculture, Foreign Agriculture Service Production, Supply, and Distribution data. This article is a companion to the November 4, 2020 farmdoc daily article that examined China’s aggregate grain and oilseed sector.
Production vs. Domestic Consumption
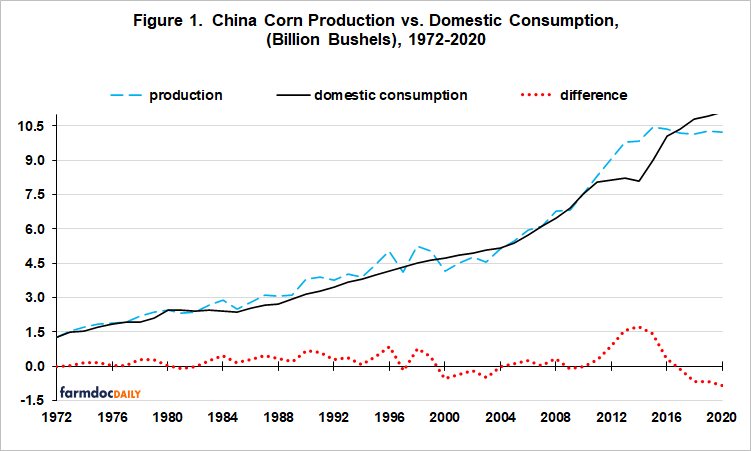
In one third of the years since 1971 domestic consumption exceeded China’s production of corn (see Figure 1). Longest period of consecutive years of production shortfalls is 2000–2004. Second longest is 2017–2020. During the current period, average shortfall has been 590 million bushels per year, or 6% of the 10.2 billion bushel average annual production. In 2000-2004, annual shortfall averaged 7% of annual production. In both periods, shortfalls arose because of continuing growth in consumption along with a small decline in average harvested acres over the period (see Figure 2 below) and yields that were slightly but consistently below trend throughout the period (see Fuglie below).
Harvest Area
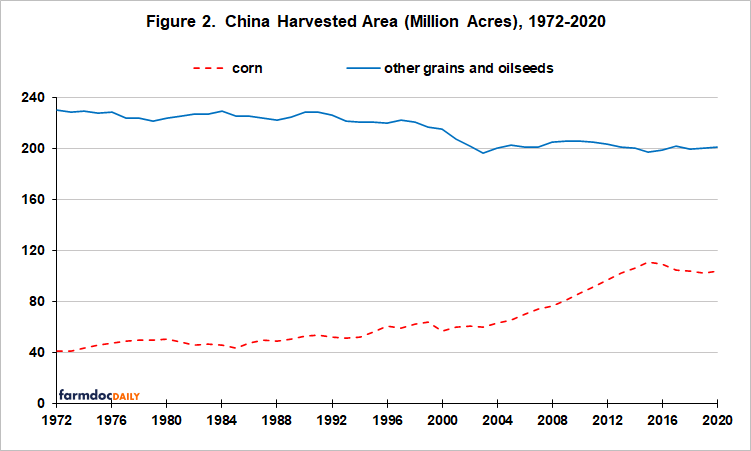
Area harvested for corn in China increased 16 million acres between1972–1976 and the 2000–2004 period of production shortfall (see Figure 2). Thereafter, it surged 45 million to average 105 million acres by 2012–2016. Acres of corn have averaged 104 million acres since 2016. Acres of other grains and oilseeds (see Data Note 1) declined 24 million in the first period but by only 4 million thereafter. Growth in China’s corn acres since 2004 has mostly come from outside the grain and oilseed sector whereas it likely came from within the grain and oilseed sector before 2000. Corn’s share of harvested grain and oilseed area increased from 15% to 34% between 1972 and 2020, or by 0.39 percentage point per year.
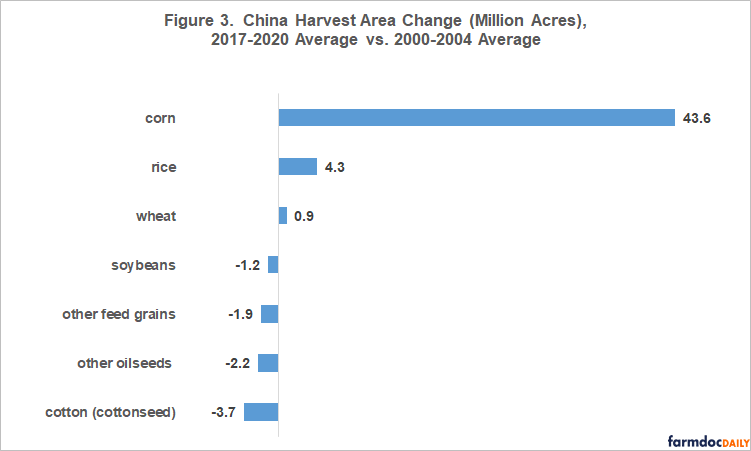
Figure 3 documents corn’s central role in China’s management of its field crop sector since 2000-2004. Acres of rice and wheat also increased while acres of oilseeds and other feed grains declined, but their changes are dwarfed by the change in corn acres.
Yield
Since 1971, trend yield has increased faster in China for corn than for other grains and oilseeds as a group. Corn’s advantage is 51%: (0.083 vs. 0.055 metric ton per hectare per year). It is likely one reason corn’s share of harvested grain and oilseed acres has increased. Explanatory power of the linear time trend is high: 94% for corn and 96% for other grains and oilseeds, reinforcing the visual picture from Figure 4 that trend rate for both yields has likely changed little over the analysis period.
China has invested heavily in public agricultural research and development since 2000, and now exceeds the US in such spending (Fuglie). So far, trend yields do not appear to be impacted. However, enough years have passed that China’s trend yields bear close watching going forward.
Concluding Observations
If China’s consumption of corn and yield growth continue on their post 1971 paths, the answer to “Will China become a consistent, growing importer of corn?” depends on whether or not the years after 2017-2020 turn out to be a repeat of the years after 2000-2004. A repeat will require China to substantively increase corn acres.
The assumption on yield growth is critical given China’s large public expenditures on agricultural research and development. So far, it does not appear to have impacted trend yields. Will it begin to do so? Yield growth bears close watching.
If yield growth does not accelerate appreciably, an important question becomes, “Where will future corn acres come from?”, or from a different perspective, “How high will corn prices have to be in China to attract corn acres from other current uses?” How China manages its land bears close watching.
It is often argued that China is cultivating most of its potential crop acres. The greater is China’s constraint on cropland and the longer yields stay on their historical path, the more important it is to follow China’s grain and oilseed sector as a whole, not just individual crops (see November 4, 2020 farmdoc daily article). Shifting acres to one crop will likely increase imports of another crop.
A rarely discussed land management issue is whether China over plants corn vs. soybeans. The US harvests about 1.0 acre of soybeans per acre of corn harvested for grain. China’s ratio is 0.20. A better balance between corn and soybeans in China may result in higher corn and soybean yields, which US evidence suggests (see Data Note 2). More broadly, “Does China need to rethink its cropping practices, including its mix of crops and by extension its mix of imports?”
In conclusion, evidence is not definitive but market dynamics for corn in China may be on the verge of changing and China may be entering a new trajectory. Going forward, production trends in China require as much attention as production trends in South America and the Ukraine-Russia.
Data Notes
- Other grains are barley, millet, oats, milled rice, sorghum, and wheat. Oilseeds are cottonseed, peanuts, rapeseed, soybeans, and sunflowers.
- A commonly used yield bump in the US for corn after soybeans vs. continuous corn is 10% (see, for example, the October 27, 2020 farmdoc daily article). A bump in soybean yields is more debated, but Zulauf and Specht’s survey of agronomy specialists at US universities found their average response was an 8% increase in soybean yield following corn vs. continuous soybeans (their average response for corn after soybeans vs. continuous corn was 10%). Higher yields are usually attributed to the corn-soybean rotation disrupting disease and pest cycles, but could also reflect other impacts upon soil including the nitrogen fixing ability of soybeans.
References and Data Sources
Fuglie, K. 2018. R&D Capital, R&D Spillovers, and Productivity Growth in World Agriculture. Applied Economic Perspectives and Policy. 40 (3): 421–444.
Schnitkey, G., K. Swanson, N. Paulson, C. Zulauf and J. Coppess. “Revised 2021 Crop Budgets Lead to Higher 2021 Return Projections.” farmdoc daily (10):189, Department of Agricultural and Consumer Economics, University of Illinois at Urbana-Champaign, October 27, 2020.
US Department of Agriculture, Foreign Agriculture Service. March 2020. PS&D: Production, Supply, and Demand. https://apps.fas.usda.gov/psdonline/app/index.html#/app/home
Zulauf, C. “China’s Grain and Oilseed Sector.” farmdoc daily (10):193, Department of Agricultural and Consumer Economics, University of Illinois at Urbana-Champaign, November 4, 2020.
Zulauf, C. R. and A. Specht. December 2004. “Corn-Soybean Rotation: Its Impact on Acreage Response to Price.” Report to Economic Research Service, U.S. Department of Agriculture for USDA Cooperative Agreement #43-3AEK-2-80060.
Disclaimer: We request all readers, electronic media and others follow our citation guidelines when re-posting articles from farmdoc daily. Guidelines are available here. The farmdoc daily website falls under University of Illinois copyright and intellectual property rights. For a detailed statement, please see the University of Illinois Copyright Information and Policies here.


