US Labor Market and Labor Wage Inflation
Lack of labor is often mentioned when discussing US supply chain problems. To attract employees, firms may need to raise wages, which can then lead to inflation. Inflation has implications for US Federal debt and interest rates discussed in the December 20 and 23, 2021 farmdoc daily articles. The US labor market is examined since 1948, the first year that the labor force participation rate is available from the Bureau of Labor Statistics. The labor force participation rate since 1948 tracks the working life of Baby Boomers. In particular, it has declined as Baby Boomers retire. A simple analysis finds lower labor force participation is strongly statistically associated with higher real hourly earnings in manufacturing. An important question emerges, “Will wages have to increase to attract younger generations into the work force, which will make wage inflation a defining, on-going attribute of the US economy in coming years?” The data in this article are from the Federal Reserve Bank of St. Louis.
Labor Force Participation
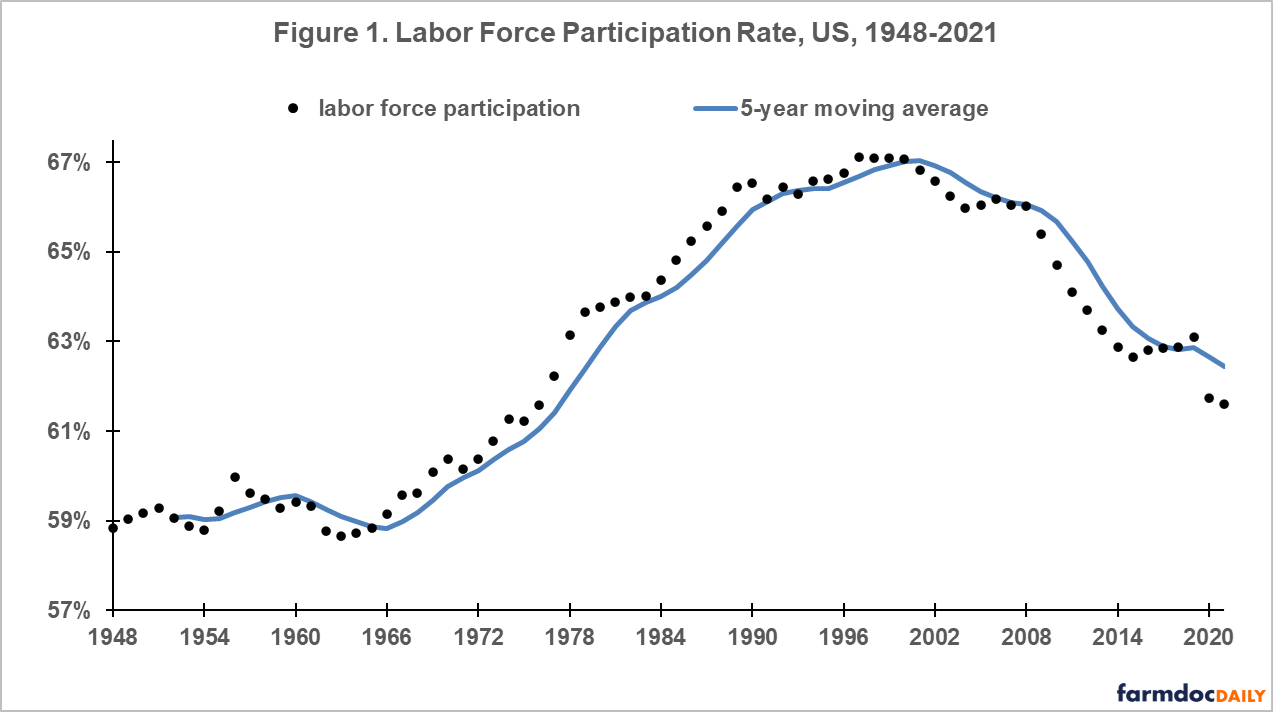
The US population is expected to grow slowly (Vespa, Medina, and Armstrong, 2020), making labor force participation more important to the future size of the US labor force. Since 1948, US labor force participation rate (see Data Note 1) tracts reasonably well the working life of Baby Boomers. Baby Boomers are usually defined as those born between 1946 and 1964 (Wikipedia, 2021). The labor participation rate did not consistently exceed 60% until 1969 (see Figure 1) when the oldest Baby Boomers were 23. Participation peaked at 67% in 1994-2002, then began to decline. The decline accelerated in 2008, which coincided not only with a US real estate crisis but also with the oldest Baby Boomers turning 62, the earliest age to collect Social Security. These associations remain if a 5-year moving average is used to focus on longer-term changes. The associations prompt this question: “Are Baby Boomers more willing to work than Americans who preceded or followed them?”

Manufacturing Hourly Earnings
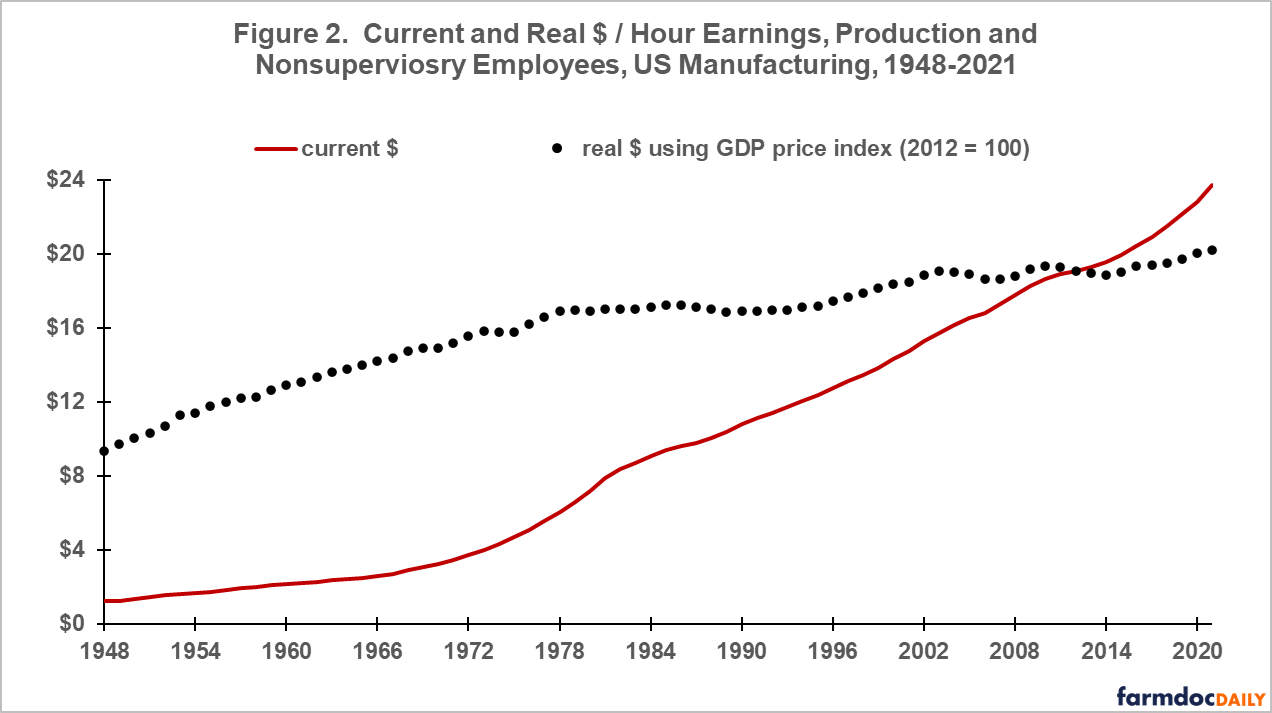
Average hourly earnings of production and nonsupervisory employees in US manufacturing have grown steadily since 1948 (see Figure 2). Growth was fastest during the high inflation 1970s. Deflating hourly earnings by the GDP (Gross Domestic Product) implicit price deflator considerably dampens the long run uptrend. Since 1948, nominal hourly earnings have increased by roughly a factor of 20 while real hourly earnings have roughly doubled.

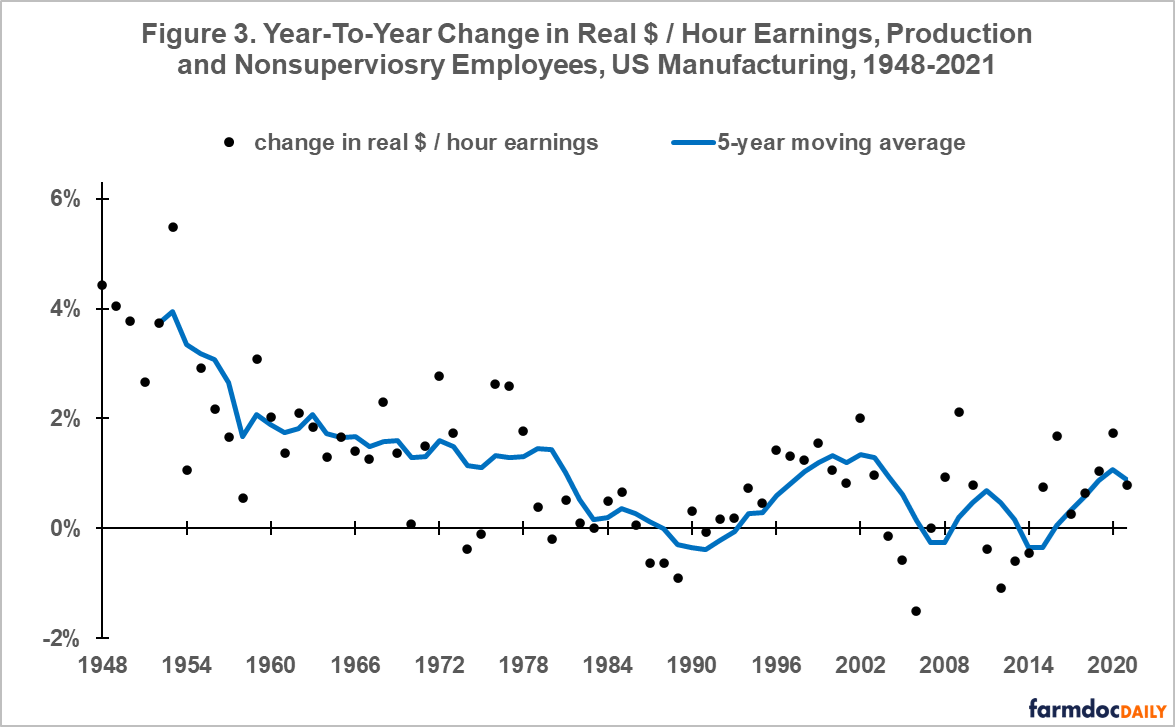
Figure 3 contains the annual year-to-year change in real hourly manufacturing earnings. Growth was highest in the 1950s. The first year that real hourly earnings declined was 1974. Declines have occurred in 13, or about 30%, of years since. The last year with a decline was 2014.

Labor Productivity
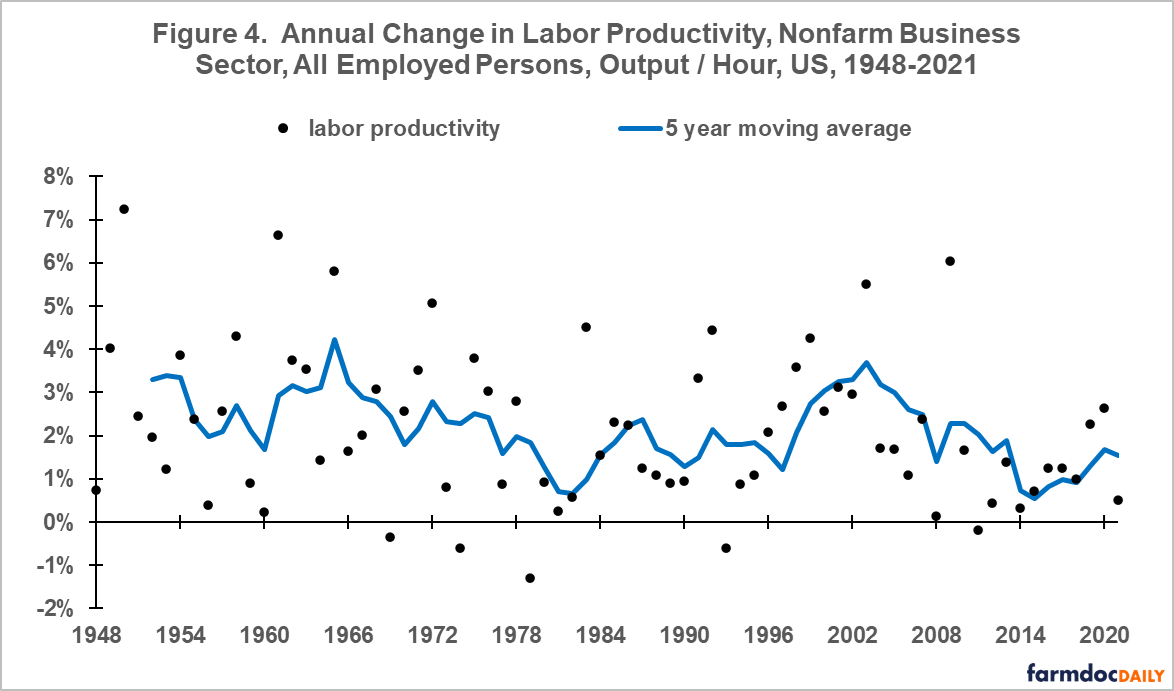
A positive relationship has consistently been found between changes in labor earnings and changes in labor productivity. Figure 4 contains the annual percent change in labor productivity of all employed persons in the US nonfarm business sector as measured by output per hour (see Data Note 2). Considerable year-to-year variability exists around the 1948-2021 average annual increase in labor productivity of +2.2%. The range in annual change is -1.3% to +7.3%.

Explaining Change in Real Annual Earnings
A regression analysis was conducted of the 5-year moving average of annual change in real manufacturing hourly earnings. Explanatory variables were the 5-year moving averages of labor force participation rate and labor productivity, as well as a time trend. Each explanatory variable had a strong statistically significant relationship with the 5-year moving average of annual change in real manufacturing hourly earnings. Labor force participation had a negative sign, implying hourly earnings increase as labor force participation declines. As expected, hourly earnings increased as labor productivity increased. Once labor force participation and labor productivity were taken into account, real hourly earnings have declined over time. Several factors can explain a negative time trend, including internationalization of the US supply chain which has shifted production to countries with cheaper labor. The three variables explained a strongly statistically significant 68% of the year-to-year variation in the 5-year moving average of annual change in real manufacturing hourly earnings.

Summary Observations
This article presents evidence that (a) US labor force participation has been declining in the 21st Century and (b) lower labor force participation has historically been associated with higher hourly earnings.
Some, perhaps a notable part, of the 21st Century decline in US labor force participation may be due to retiring Baby Boomers having a greater propensity to work than succeeding generations. If so, employers will need to raise wages to attract more workers.
Moreover, the Federal infrastructure bill creates new jobs, likely adding to labor wage inflation. The proposed “Build Back Better” bill also contains programs that creates new jobs, for example early childhood educators.
The preceding points imply a key question, “Is labor wage inflation an emerging US issue?”
Many factors that impact inflation are transitory in nature, such as reductions in crop output due to weather and higher energy prices due to a weather-related surge in demand or reduction in supply.
The distinction between transitory and on-going inflation is why economists often remove farm, food, and energy prices to calculate what is called the core inflation rate. However, it is important to note that farm, food, and energy prices can contribute to on-going inflation, especially if demand is growing faster than supply.
Labor wage inflation is less likely to be transitory and more likely to be sustained, especially if the cause is a structural change in labor supply or demand. Declining labor force participation is a structural change in labor supply.
Labor wage inflation often translates into higher general inflation. Workers have more income to spend which translates into more demand. Assuming all else remains the same, higher demand means higher prices for goods and services.
If expectations for continuing inflation takes hold, often called inflation psychology; inflationary pressures mount further as consumers buy now to avoid paying higher prices in the future.
Moreover, over the last two years, the inflation adjusted 10-year US Treasury Bond interest rate has been negative (December 22, 2021 farmdoc daily). The combination of inflation and negative real interest rates discourages investment in interest rate instruments such as bank CDs since earned interest will not cover inflation price increases. It is reasonable to assume that some, maybe a lot, of money in this safe investment will move to riskier investments, such as stocks and real estate.
Once inflation takes hold, it is difficult to cure. For example, when the US finally decided to cure its inflation problem in the late 1970s, it took a sustained period of high real interest rates to cure it. High Federal outlays for interest on US debt materially constrained US policy and spending, and real estate investments, such as farmland, and stocks struggled with low returns and declining values.
Another potential solution to inflation is new technology that improves labor productivity, such as robots.. Faster growth in output increases supply, thus dampening general price inflation. However, the history of US labor productivity as presented in Figure 2 prompts caution regarding this option.
Another solution is increased immigration to increase US labor supply, but political discord prompts caution regarding the feasibility of this option at this time.
In closing, it is too early to know if sustained higher inflation, in particular labor wage led inflation, is an emerging, on-going US problem. If it is an emerging, on-going problem; it may take several years before the US decides to act or is forced to act by markets. Nevertheless, it is not too early to track labor wage inflation as an early warning signal.
Data Notes
- Conceptually labor force participation is the percent share of the working age population who are employed or unemployed but actively looking for work. It is calculated as a percent of the civilian non-institutional population age 16 and older, which is the population universe used for Current Population Survey (CPS) statistics published by the Bureau of Labor Statistics. Excluded from this population are (1) active duty members of the US Armed Forces and (2) people in institutions such as residential care facilities and correctional institutions. It includes citizens of foreign countries who reside in the US and do not live on the premises of an embassy. Unemployed does not mean collecting unemployment insurance. Actively looking for work means (1) at least one active effort was made to find a job during the 4-week period ending with the CPS survey reference week or (2) temporarily laid off and expecting to be recalled. Looking at help wanted ads but taking no further action is not considered an active job search. Source for this data note is US Department of Commerce, Bureau of Labor Statistics, 2021.
- A measure of annual percent change in manufacturing labor productivity is not available until 1988. Given its much shorter period of availability, it is not used in this analysis.
Data Sources
Federal Reserve Bank of St. Louis. 2021, December. Federal Reserve Economic Data (FRED). https://fred.stlouisfed.org
Vespa, J., L. Medina, and D. M. Armstrong. 2020, February. Demographic Turning Points for the United States: Population Projections for 2020 to 2060 Population Estimates and Projections. US Department of Commerce, Census Bureau Current Population Report P25-1144. Original issue March 2018. https://www.census.gov/content/dam/Census/library/publications/2020/demo/p25-1144.pdf
US Department of Commerce, Bureau of Labor Statistics. 2021, December. Labor Force Statistics from the Current Population Survey: Concepts and Definitions. https://www.bls.gov/cps/definitions.htm#lfpr
Wikipedia. 2021, December. Baby Boomers. https://en.wikipedia.org/wiki/Baby_boomers
Zulauf, C., G. Schnitkey, K. Swanson and N. Paulson. “US Federal Debt.” farmdoc daily (11):167, Department of Agricultural and Consumer Economics, University of Illinois at Urbana-Champaign, December 20, 2021.
Zulauf, C., G. Schnitkey, K. Swanson and N. Paulson. “US Interest Rates.” farmdoc daily (11):169, Department of Agricultural and Consumer Economics, University of Illinois at Urbana-Champaign, December 23, 2021.
Disclaimer: We request all readers, electronic media and others follow our citation guidelines when re-posting articles from farmdoc daily. Guidelines are available here. The farmdoc daily website falls under University of Illinois copyright and intellectual property rights. For a detailed statement, please see the University of Illinois Copyright Information and Policies here.


