Corn Upside and Downside Price Scenarios
The Russian invasion of Ukraine has created uncertainty in global grain exports. This uncertainty has and likely will continue to result in short-term opportunity for US corn exports. Grains are a global, fungible commodity where supply finds demand. US and other grain exporting countries will be needed to fill global market voids. Whether this need lingers longer-term is unknown. While the additional demand for US corn can create multiple upside scenarios from a price perspective, farmers and others should also consider longer-term risks to the forecast.
This article conducts scenario analysis around US corn prices, examining plausible “what-if” events and predicting possible outcomes. Scenario analysis can provide a better understanding of upside opportunities as well as downside risks. A better understanding of the potential outcomes of these events can help in planning and managing should they occur. These scenarios are built using the Compeer Agricultural Scenario Builder, a model developed at the University of Illinois that is used to build a set of likely prices for stress testing agricultural loans (see farmdoc daily, August 13, 2019).
Short-term Situation and Upside Price Scenarios
Ukraine accounted for 13% of world corn exports in the 2020/21 year, according to International Grains Council data. Since the Russian invasion, Ukraine’s agricultural exports have been very limited compared to normal. The war will also interrupt spring planting progress in Ukraine. Ukrainian farmers are facing fuel and fertilizer shortages in addition to numerous challenges in getting a crop into the ground. Many speculate what does get planted will go to fulfill domestic needs. How long and to what extent Ukraine’s exports are limited, and how much of a corn crop Ukraine will be able to plant, is unknown.
The International Grains Council sharply reduced its forecasts for Ukrainian wheat and corn on March 17 because of the war. It forecasted corn exports for 2021/22 at 21.7 million metric tons, down by one-third from its February forecast. Countries that have historically purchased corn from Ukraine are seeking alternatives. Recent weekly USDA FAS data indicates China has been increasing corn purchases from the US, the largest since December, as Ukraine spring plantings remain in doubt.
We present three scenarios of prices, two involving potential increases in corn demand followed by one around potential decrease. The likelihood of these scenarios may be viewed as dependent on the changing context of current markets and geopolitical situation. Keep in mind that these alternatives represent only one set of “likely” prices out of a range of “likely” outcomes and a large degree of uncertainty remains.
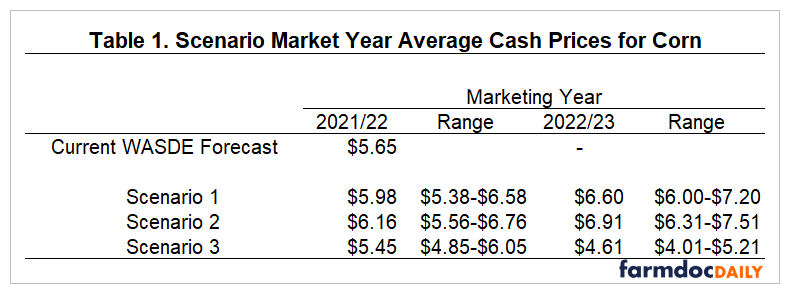
Corn prices for all scenarios are shown in Table 1. An average price as well as a range around each price is shown.
Scenario 1:
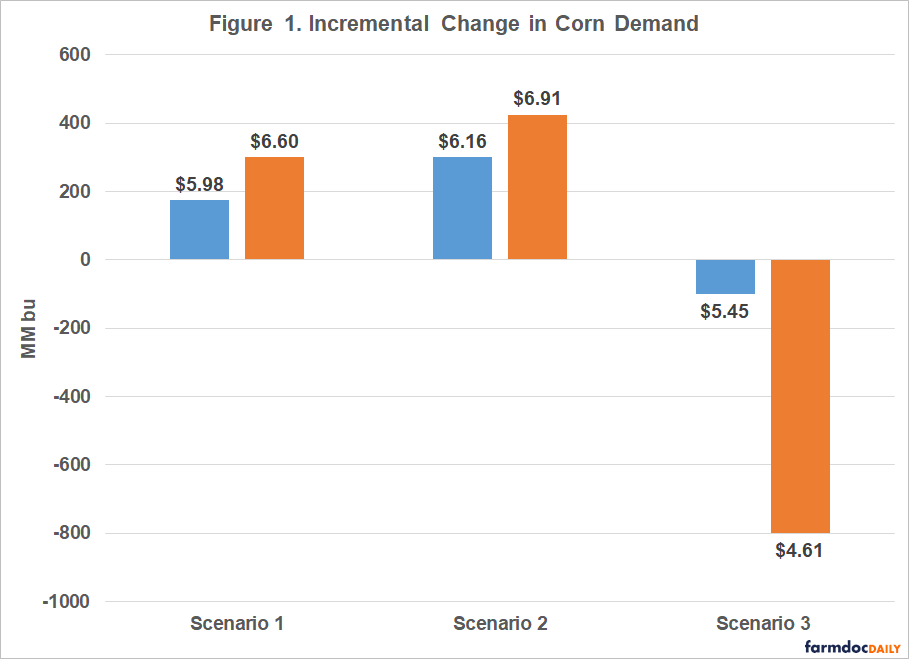
- In 2021/22 Marketing Year (MY), the US picks up 175MM bushels of corn export demand above the current March 2022 World Agricultural Supply and Demand Estimates (WASDE) forecast produced by the USDA.
- In 2022/23 MY, incremental corn export demand grows to 300MM bushels.
- This scenario assumes that Ukraine’s corn exports fall by 75% and the US absorbs a pro-rata share of the remaining.
- 92MM acres of corn are planted in 2022/23 (assumed for all 3 scenarios)
- US corn farm prices increase 6% above the current March WASDE forecast to $5.98/bu for the 2021/22 MY average and increase 17% to $6.60/bu for the 2022/23 MY average.
Scenario 2:
- In 2021/22 MY, the US picks up 300MM bushels of corn export demand above the current March 2022 WASDE forecast.
- In 2022/23 MY, incremental corn export demand grows to 425MM bushels.
- This scenario assumes that Ukraine is largely unable to export corn and the US absorbs a pro-rata share of the remaining corn exports.
- US corn farm prices increase 9% above the current March WASDE forecast to $6.16/bu for the 2021/22 MY average and increase 22% to $6.91/bu for the 2022/23 MY average.
- In 2022/23, ending stocks fall below 500MM level, lower than the 800MM level seen in 2012/13.

 Both of these scenarios create additional demand for US corn bushels and result in higher prices than the current USDA March WASDE forecast. Of note, these prices are similar to cash prices last seen in the low stock periods of 2011/12 and 2012/13 MY’s of $6.22/bu and $6.89/bu respectively. While current futures prices may range much higher (MAY22 contract has traded in the $7.25 to $7.85 range), it is important to emphasize these prices reflect average cash received prices for the whole marketing year.
Longer-Term Downside Scenario
The above scenarios reflect an optimistic outlook for corn demand and hence price, but conditions are inconstant. Risks still abound. Many unknowns exist for the new crop year: weather, flare-ups of food v. fuel debate, poultry and livestock disease, behavior of global trading partners, length of current conflict, rising interest rates, among others. Interest rates alone are one potential headwind. In an effort to tamper inflation, the Federal Reserve raised the fed funds rate 25 basis points at its March meeting, and officials are forecasting six to seven additional hikes this year. The Fed could be tightening into an already slower-growing economy. It is noteworthy that the overwhelming majority of the Fed’s rate-raising periods since the 1950s has ultimately resulted in some type of recession.
Risk of recession is just one potential headwind. In contrast to the scenarios above, we present a longer-term scenario of price around pull-backs in corn demand. These pull-backs could originate from weaker domestic demand, weaker global demand or a combination of both. Keep in mind that this downside alternative represents one set of “plausible” prices and does not necessarily represent a “likely” outcome.
Scenario 3:
- In 2021/22 MY, the expected increase in export demand does not materialize and actually falls by 100MM bushels below the current March 2022 WASDE forecast.
- In 2022/23 MY, corn demand falls 800MM bushels.
- This assumes a combination of normal global trade patterns resuming more quickly as well as further shift in exports to global competitors combined with a pull-back in domestic feed demand due to economic stress fueling lower protein consumption.
- US corn farm prices dcrease 4% below the current March WASDE forecast to $5.45/bu for the 2021/22 MY average and decrease 19% to $4.61/bu for the 2022/23 MY average.
This downside scenario lowers demand forecasts for US corn bushels and reverts prices to levels more recently experienced in 2020/21. However, prices of $4.61/bu corn combined with today’s high input costs would result in lower margins than 2020/21.
Summary
Scenario analysis (exploring plausible what-if’s), can provide a better understanding of upside opportunities and downside risks. A better understanding of the potential outcomes can help in planning and managing should they occur. While current conditions are creating additional demand for US corn that translates to higher prices in the near term, farmers and others should also consider longer-term risks to the forecast.
References
Bubela, H., and G. Schnitkey. “Adverse Corn and Soybean Price Scenarios for 2020 and 2021.” farmdoc daily (9): 149, Department of Agricultural and Consumer Economics, University of Illinois at Urbana-Champaign, August 13, 2019.
International Grains Council. March 17, 2022. GMR Summary Tables, Supply and Demand: Grains. http://www.igc.int/en/gmr_summary.aspx.
Schnitkey, G., C. Zulauf, N. Paulson and K. Swanson. “Should the Russian-Ukraine Conflict Impact 2022 Acreage, Crop Insurance, and Commodity Title Decisions in the Midwest?” farmdoc daily (12):31, Department of Agricultural and Consumer Economics, University of Illinois at Urbana-Champaign, March 8, 2022.
Acknowledgements
Heidi Bubela is Director Quantitative Analysis at Compeer Financial (www.compeer.com) The Compeer Agricultural Scenario Builder described in this paper was developed at the University of Illinois.
Disclaimer: We request all readers, electronic media and others follow our citation guidelines when re-posting articles from farmdoc daily. Guidelines are available here. The farmdoc daily website falls under University of Illinois copyright and intellectual property rights. For a detailed statement, please see the University of Illinois Copyright Information and Policies here.


