Are Long-Run Prices Still $4 for Corn, $10 for Soybeans, and $5.50 for Wheat?
The Congressional Budget Office (CBO) recently released projected outlays for Federal farm programs from 2021 to 2031. To make these ten-year projections, CBO used estimates of commodity prices over the next 10 years. CBO’s 2031 price estimates are $3.90 per bushel for corn, $10 per bushel for soybeans, and $5.15 per bushel for wheat. Overall, CBO has prices returning to 2014-2020 averages, representing what may be considered long-run prices. Those prices are well below projections for 2021 and 2022 levels. If prices move back to long-run averages, considerable adjustments will need to occur in the agricultural sector.
Long-Run Prices
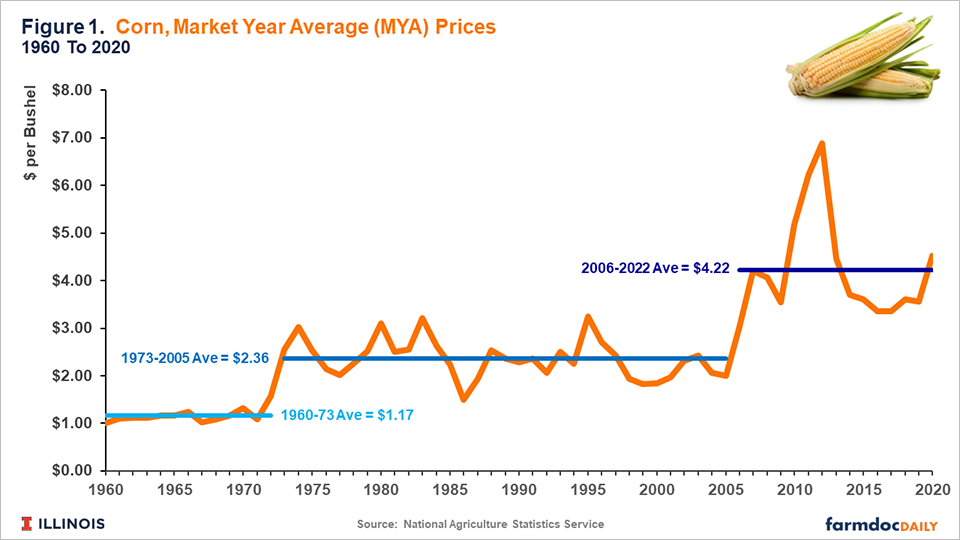
Prices of agricultural commodities typically vary around a long-run average but do not trend up or down (see farmdoc daily March 29, 2011, February 27, 2013). This feature is illustrated in Figure 1, which shows Market Year Average (MYA) prices for corn. MYA prices represent the average price received for corn by all U.S. farmers and is calculated by the National Agricultural Statistics Service.
Three periods are discernable in Figure 1:
- Prices average $1.17 from 1960 to 1973.
- Prices reached a new higher plateau in 1973 U.S. exports began growing in the late 1960s due to several evolutions in U.S. policy. In 1973, the Soviet Union made large grain purchases, reversing trade policy dating back to the Bolshevik Revolution, thereby open more markets to global trade. From 1973 to 2005, corn prices averaged $2.36 per bushel. Sometimes corn prices were considerably above the $2.36 average, as occurred in 1995 when corn prices were $3.24 per bushel. Some believed that prices had reached a new higher plateau, but they had not. Corn prices again went below the $2.36 average, falling to $1.94 per bushel in 1998.
- Prices again moved to a new higher plateau in 2006, primarily due to the growth of corn used in ethanol production. From 2006 to 2020, corn prices averaged $4.22 per bushel.

In its May 2022 World Agriculture Supply and Demand Estimate (WASDE) report, the Office of the Chief Economist projected corn at $5.90 per bushel for the 2021 marketing year, well above the $4.22 average from 2002 to 2020. This has led some to suggest that prices may be moving to another new higher plateau. However, long-run forecasts made by the USDA, as well as CBO projections, suggest otherwise.
Price Forecasts
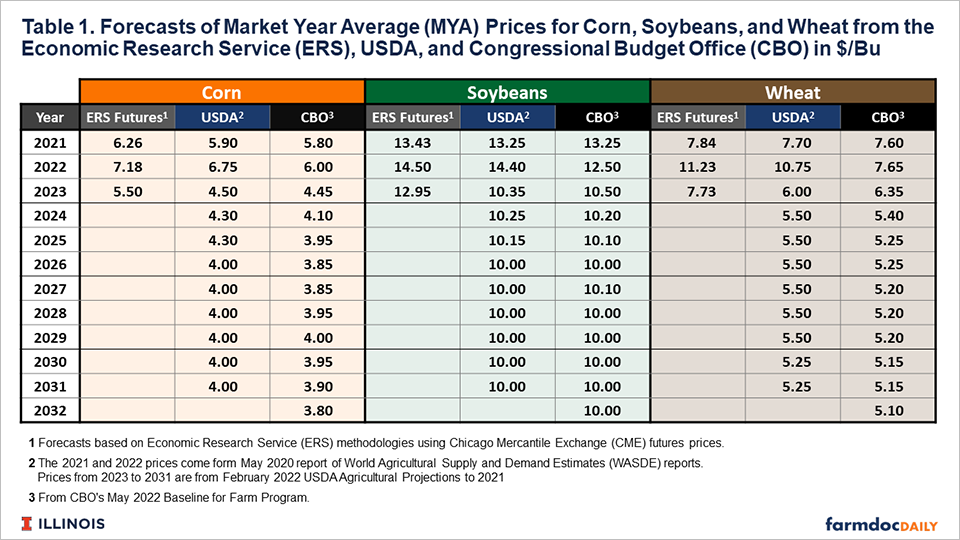
Table 1 shows forecasts from three sources:
- ERS Futures. The Economic Research Service (ERS), an agency in the USDA, publishes a methodology to estimate MYA prices based on Chicago Mercantile Exchange (CME) futures prices (here). This methodology uses CME futures prices to project monthly prices, which are then adjusted to cash prices based on historical basis. The MYA price is then estimated using historical monthly marketing weights. Values for 2021 and 2022 shown in Table 1 come directly from the spreadsheet downloaded from the ERS website. These websites were used to project the 2023 MYA price based on futures settlement prices on May 27th, 2022.
- Each February, multiple agencies within USDA release final estimates of the next ten-year supply and demand situation at its Annual Agricultural Outlook conference. The 2022 version of this report, entitled USDA Agricultural Projections to 2023 gives these usage estimates as well as projections for prices from 2021 to 2031. These prices are shown in Table 1 for 2023 to 2031. The 2021 and 2022 forecasts come from the May 2022 WASDE report.
- The CBO shows prices used in its May 2022 estimates of farm program outlays (here).
The USDA and CBO projections are made by governmental agencies that have contact with one another. USDA forecasts likely influence CBO forecasts, and vice versa. As a result, the two forecasts are not totally independent of one another.
Corn
Currently, all forecasts have the 2021 MYA prices well above the $4.22 long-run average: $6.26 for the ERS forecast, $5.90 for USDA, and $5.80 for 2021 (See Figure 2). All forecasts have 2022 at higher prices: $7.18 for ERS forecast, $6.75 for USDA, and $6.00 for CBO. Then all three have lower prices in 2023: $5.50 for ERS forecast, $4.50 for USDA, and $4.45 for CBO.

Futures contracts with a significant amount of trade do not exist after 2023. As a result, only USDA and CBO forecasts are available for the out years. USDA projects prices to reach $4.00 by 2026 and then remain at that level through 2031. In the out years, USDA is projecting prices below the 2006-2020 average of $4.22.
CBO also has prices below the 2006-2020 average of $4.22. In out years, CBO price estimates range from $4.10 in 2024 to $3.80 in 2032.
Both USDA and CBO are forecasting much lower prices after 2022 than are occurring in 2021 and 2022. In essence, 2021 and 2022 are an aberration caused by a combination of tight global stocks, production uncertainty, strong demand for grains from China, and grain disruptions from the Ukraine-Russia conflict. However, their forecasts suggest that the situation is not permanent, and prices are expected to return to current longer-run averages.
Soybeans
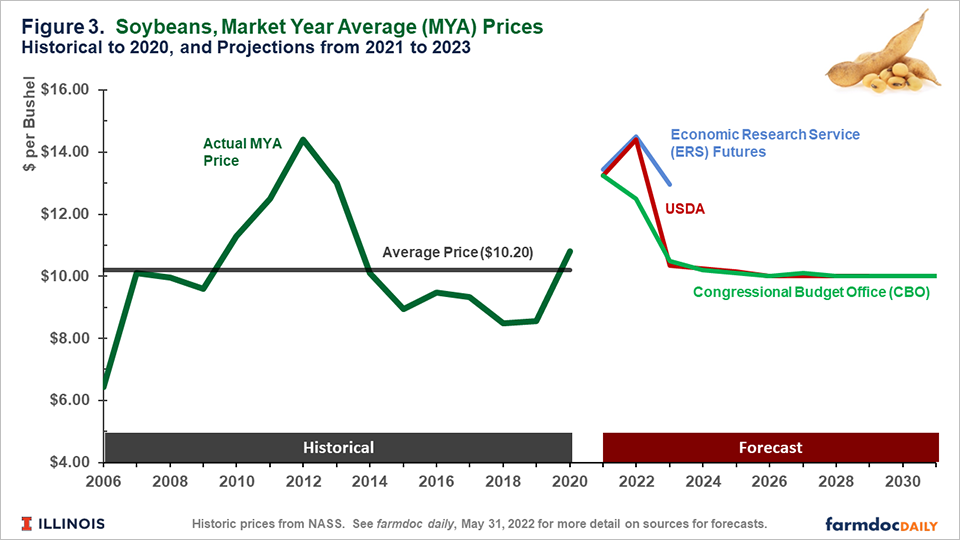
A similar situation exists for soybeans. From 2006 to 2020, soybeans averaged $10.20 per bushel (see Figure 3). MYA prices are projected to be well above the $10.20 average in 2021 and 2022. USDA is forecasting a price of $13.25 for 2021 and $14.40 for 2022. For both years, ERS Futures and USDA approaches result in roughly similar prices. CBO estimates a drop in prices in 2022 to $12.50, $2.00 lower than either the ERS futures-based forecast and the estimates used in USDA’s long-term projections.

Both USDA and CBO have soybeans headed to 10.00 per bushel by 2026 and then remaining at that level throughout the remainder of the projection period.
Wheat
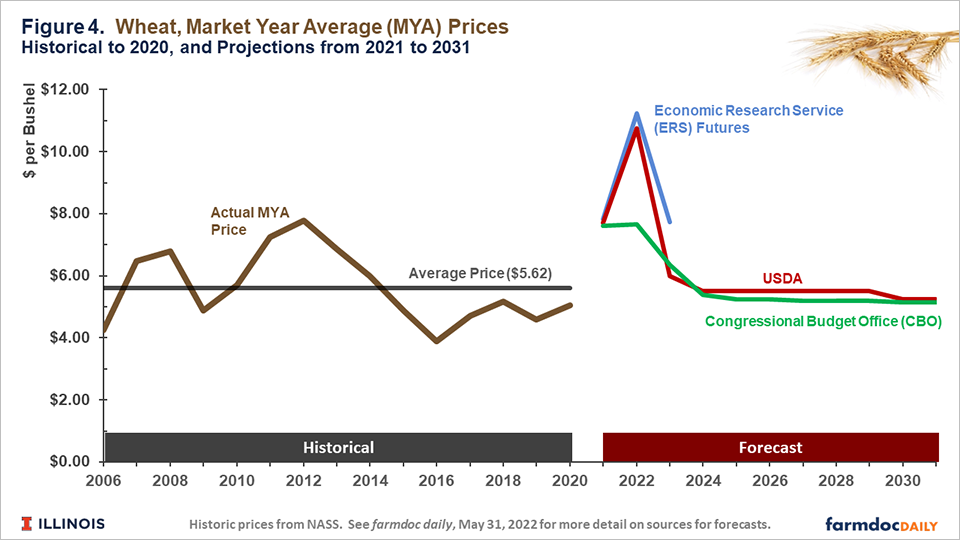
Wheat’s average price from 2006 to 2020 was $5.62. For 2022, the ERS forecast is $11.23 and USDA estimate is $10.75, while the CBO estimate is lower at $7.65 (see Figure 4). USDA has wheat prices reaching $5.50 by 2024 and then dropping further to $5.25 for 2030 and 2031. CBO forecasts $5.25 in 2025. After that, reductions continue until a $5.10 price is reached in 2032.
Commentary
Both USDA and CBO forecast methods have prices moving lower after a higher period in 2021 and 2022. This is a reasonable belief and modeling result, particularly given that historical changes in long-run prices occur only occasionally and are usually associated with a sustained change in demand. Movements back to 2006-2020 averages suggest that the current robust market resulting from China and the Ukraine-Russia conflict are transitory and will also result in growth in agricultural output, leading to lower prices.
If prices do indeed move back to 2006-2020 averages, adjustments in the agricultural sector will need to occur. In Illinois, the 2022 break-even price for corn is projected at $4.73 per bushel for corn and $11.06 per bushel for soybeans (farmdoc daily, December 21, 2021). Both of those break-even prices are above price projections by USDA and CBO in years after 2024, suggesting that costs will need to be reduced. Current events contributing to strong commodity prices are also leading to higher production costs, particularly for inputs such as fertilizers and other chemicals. While a component of these cost increases may also be transitory, additional adjustments are also likely to be needed if commodity prices return to lower levels as projected. Lower returns are usually associated with downward pressures on cash rental rates, which then could lead to farmland price declines.
Still, those ramifications are in the future. The timing of price declines is uncertain. The Ukraine-Russia war could have much longer-run impacts than are currently anticipated. How inflation and other events play out is uncertain.
References
Congressional Budget Office. CBO’s May 2022 Baseline for Farm Programs, May 2022. https://www.cbo.gov/system/files/2022-05/51317-2022-05-usda.pdf
Economic Research Service, U. S. Department of Agriculture. Season-Average Price Forecasts. Last updated, Friday, May 13, 2022. https://www.ers.usda.gov/data-products/season-average-price-forecasts
Irwin, S. and D. Good. "A New Era in Crop Prices?" farmdoc daily (1):27, Department of Agricultural and Consumer Economics, University of Illinois at Urbana-Champaign, March 29, 2011.
Irwin, S. and D. Good. "The New Era of Crop Prices — A Five-Year Review." farmdoc daily (3):38, Department of Agricultural and Consumer Economics, University of Illinois at Urbana-Champaign, February 27, 2013.
Schnitkey, G., C. Zulauf, N. Paulson and K. Swanson. "2022 Break-Even Prices for Corn and Soybeans." farmdoc daily (11):168, Department of Agricultural and Consumer Economics, University of Illinois at Urbana-Champaign, December 21, 2021.
U. S. Department of Agriculture. USDA Agricultural Projections to 2031. February 2022. https://www.usda.gov/sites/default/files/documents/USDA-Agricultural-Projections-to-2031.pdf
U. S. Department of Agriculture. World Agricultural Supply and Demand Estimates (WASDE -624-2), Released May 12, 2022. https://usda.library.cornell.edu/concern/publications/3t945q76s?locale=en
Disclaimer: We request all readers, electronic media and others follow our citation guidelines when re-posting articles from farmdoc daily. Guidelines are available here. The farmdoc daily website falls under University of Illinois copyright and intellectual property rights. For a detailed statement, please see the University of Illinois Copyright Information and Policies here.


