


Update on US Interest Rates and Inflation
In response to higher inflation, the Federal Reserve has raised the effective Federal Funds interest rate from 0.08% in January 2022 to 3.08% at the end of September 2022. A key question is how much more will it raise rates? An examination of US interest rates and inflation since 1962 suggests the answer depends on whether higher current inflation is being caused by temporary or more permanent factors. The 10-year Treasury Bond market believes current inflation is mostly temporary. If this view is correct, history suggests Federal Reserve rate increases are close to the end. But, markets are not always right. If current higher inflation mostly reflects more permanent factors, more rate increases are likely in the coming years. The data used in this article are from the Federal Reserve Economic Data (FRED) maintained by the Federal Reserve Bank of St. Louis.
Interest Rates: The Federal Reserve has direct control over the Federal Funds rate. Its impact on other interest rates is indirect and depends on the relationship between the other interest rate and the Federal funds rate. The 10-year US Treasury bond rate, an indicator of borrowing cost for the Federal government, and Moody’s seasoned Aaa Corporate Bond index, an indicator of borrowing cost for high quality corporations, closely follow the Federal Funds rate (see Figure 1). Since 1962, which is when information on 10-year US Treasury bond rates are first reported in FRED; correlation with the Federal Funds rate is +0.92 and +0.88, respectively (+1.0 is perfect correlation). In summary, the Federal Reserve’s impact on these two important US interest rates is considerable.
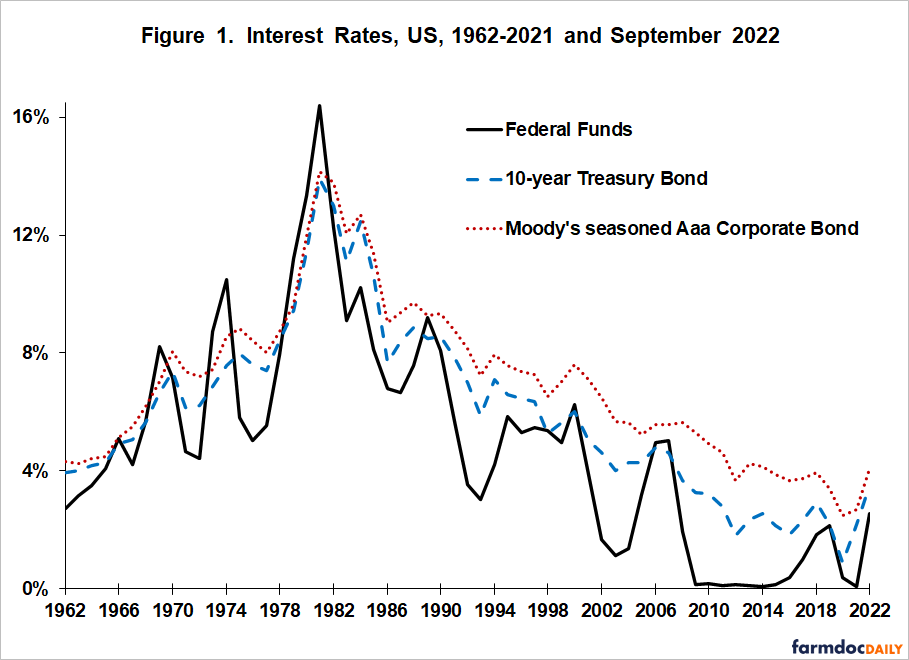
Over 1962-2021, the 10-year Treasury Bond and Moody’s Aaa Corporate index rate have respectively averaged 1.1 and 2.1 percentage points higher than the Federal Funds rate (6.0% and 7.0% vs. 4.9%). During September 2022, the differences were 0.9 and 1.5 percentage points, respectively, or somewhat less than the average historical difference.
Inflation and Interest Rates: The Gross Domestic Product (GDP) implicit price deflator index is considered the most complete measure of prices in an economy. The annual average Federal Funds rate and US inflation rate as measured by the 12-month change in the GDP deflator index track each other (see Figure 2). Their correlation is +0.70.

Over 1962-2021, the Federal Funds rate averaged 1.6 percentage points higher than GDP deflator inflation (4.9% vs. 3.3%). However, during the second quarter of 2022 or latest available data on the GDP deflator; GDP deflator inflation exceeded the Federal Funds rate by 6.8 percentage points (7.6% vs. 0.8%) after exceeding the Federal Funds rate by 4.1 percentage points in 2021. Prior to 2021, 3.4 percentage points in 1975 was the most that GDP deflator inflation had exceeded the Federal Funds rate. The differences since 2020 underscore how far inflation got ahead of the Federal Funds rate.
Actual and Expected Inflation: FRED publishes a market estimate of expected average inflation over the next 10 years. It is derived from the 10-year Treasury constant maturity bond and 10-year Treasury inflation-indexed constant maturity bond. It was first published in 2003. Over 2003-2021, 10-year inflation expectation averaged 2.0%, the same as GDP deflator inflation. During the second quarter of 2022, the expected 10-year inflation was 2.7%, or less than 1.0 percentage point above its 2003-2021 average. In contrast, GDP deflator inflation was 7.6%. A significant wedge exists between current and expected inflation.

Summary Observations
Market expectation of 10-year inflation has diverged substantially from current inflation.
Market expectation of 10-year inflation is not much higher than its average expectation of 10-year inflation over 2003-2021, implying the market believes most current inflation is temporary.
If we assume the market’s expectation of inflation is accurate, adding the average difference of 1.6% between the Federal Funds rate and GDP deflator inflation over 1962-2021 (GDP deflator inflation is available more years than expected market inflation) to the market’s 2.4% expected 10-year inflation during September 2022 implies a Federal Funds rate of 4.0%. The Federal Funds rate at the end of September was 3.1%, suggesting interest rate increases by the Federal Reserve are close to the end.
Using the historical relationships since 1962, a Federal Funds rate of 4.0% implies a 10-year US Treasury Bond rate of 5.1% and a Moody’s Aaa Corporate index rate of 6.1%.
Assuming expected market inflation is accurate, the Federal Reserve’s increase in interest rates during 2022 can be viewed as reestablishing the relationships between interest rates and inflation that have existed during much of the 21st Century.
Economics generally accepts that markets are a good, maybe the best, economic forecasting instrument, but markets are not perfect forecasters. To illustrate the implication of this point, assume the 10 year inflation rate is 5%. This rate is close to the average of the latest GDP deflator inflation (7.6%) and market expected 10-year inflation (2.4%). It also means that approximately half of current higher inflation relative to average 21st Century inflation reflects more permanent factors.
Adding the 1.6% average difference between the Federal Funds rate and GDP deflator inflation implies a Federal Fund rate of 6.6%, more than twice the current 3.1% Federal Funds rate. In other words, the Federal Reserve would currently be only about halfway through its campaign to control inflation. Using the historical relationships since 1962, a Federal Funds rate of 6.6% implies a 10-year US Treasury Bond rate of 7.7% and a Moody’s Aaa Corporate index rate of 8.7%.
The large difference between current and market expected inflation raises a warning flag. Since markets are not always accurate forecasters and since economic behavior and debt levels tend to adjust slowly, prudent financial management suggests it is wise to create contingent plans if today’s interest rates are low, not high.
The warning flag applies to farms. Assuming nothing else changes initially, higher interest rates mean lower farm income (farmdoc daily, March 21, 2022) and lower farmland prices (farmdoc daily, March 23, 2022), especially since farm debt has more than doubled over the post-1990 period of declining and largely low interest rates.
References
Federal Reserve Bank of St. Louis. 2022, October 1. Federal Reserve Economic Data (FRED). https://fred.stlouisfed.org
Zulauf, C., G. Schnitkey, K. Swanson and N. Paulson. "Land Price-to-Rent Ratio and Interest Rates." farmdoc daily (12):38, Department of Agricultural and Consumer Economics, University of Illinois at Urbana-Champaign, March 23, 2022.
Zulauf, C., B. Zwilling, G. Schnitkey, N. Paulson and K. Swanson. "Role of US Farm Interest Expense in Farm Production Expenses." farmdoc daily (12):36, Department of Agricultural and Consumer Economics, University of Illinois at Urbana-Champaign, March 21, 2022.
Disclaimer: We request all readers, electronic media and others follow our citation guidelines when re-posting articles from farmdoc daily. Guidelines are available here. The farmdoc daily website falls under University of Illinois copyright and intellectual property rights. For a detailed statement, please see the University of Illinois Copyright Information and Policies here.