


A View of the Farm Bill Through Policy Design, Part 4: ARC and PLC
Summer, having passed through the dog days of July and August only to unleash a heat dome over the middle of the country, continues to brandish an unrelenting “tongue of fire” fed by climate change (Sengupta, August 22, 2023; Smith, Higgins and Klein, August 22, 2023; Chow, August 22, 2023; Zhong, August 22, 2023; Livingston, August 21, 2023; Farmers’ Almanac, July 24, 2023). On the farm bill front, Congress continues its annual recess and progress on reauthorization remains elusive with acknowledgement that an extension will be necessary (Caraway, P., August 22, 2023; Abbott, August 14, 2023; Hill, August 9, 2023). Continuing the multi-part series presenting a view of the Farm Bill through perspectives of policy design, this article turns to the farm payment programs in Title I of the Farm Bill and explores the Agriculture Risk Coverage (ARC) and Price Loss Coverage (PLC) row crop programs (farmdoc daily, April 13, 2023; May 11, 2023; June 8, 2023). In addition, this article builds upon previous discussion, of ARC and PLC, base acres, and reference prices (farmdoc daily, June 29, 2023; July 20, 2023; August 3, 2023; August 10, 2023; August 17, 2023).
Background
The articles in this series explore the major mandatory titles, policies, and programs in the Farm Bill with updates on development of the Policy Design Lab, a web-based resource in which to explore and analyze policies. The goal is to incorporate and apply research, publicly available data, and computational resources for analysis and visualization of federal agricultural policies, guided by statutory provisions or legislative options to produce comparative analysis. For each of the major mandatory farm bill programs, the starting point is visualizing the status quo with maps and charts of the distribution of benefits and payments by State. Title I of the Farm Bill is the Commodities title, authorizing direct federal financial support to a subset of farmers based on the commodities covered by the various programs. Subtitle A contains the authorizations for the Agriculture Risk Coverage (ARC) and Price Loss Coverage (PLC) programs, including definitions and provisions for base acres, payment yields and payment acres. Subtitle B of Title I authorizes the Marketing Assistance Loan (MAL) program (including Loan Deficiency Payments (LDP) and Marketing Loan Gains (MLG)). Subtitle C contains the sugar program, while Subtitle D includes the Dairy Margin Coverage (MDC) and other dairy programs. Subtitle E authorizes the Supplemental Agricultural Disaster Assistance Programs (including Livestock Indemnity Payments (LIP), Livestock Forage Disaster Program (LFP), Emergency assistance for livestock, honeybees, and farm-raised fish (ELAP)), and Subtitle F, the Non-insured Crop Assistance Program (NAP). Subtitle G contains the administrative provisions such as payment limits. This article explores ARC and PLC, the Subtitle A programs.
ARC and PLC were first enacted by Congress in the Agriculture Act of 2014 (P.L. 113-79), and were continued by the Agricultural Improvement Act of 2018 (P.L. 115-334). The Congressional Budget Office (CBO) projects that PLC will spend approximately $33 billion and the county-based option of ARC (ARC-CO) $18.3 billion over the ten fiscal years (FY) from FY2024 to FY2033; ARC’s individual option (ARC-IC) is projected to spend $623 million over that time (farmdoc daily, February 23, 2023; May 18, 2023; CBO, May 2023). Accordingly, the entire CBO Baseline for the farm payment programs exceeds $51 billion over 10 years, or roughly $5 billion each program year. This level of spending on these programs generally aligns with payment experiences since the 1996 Farm Bill. Subtitle A program payments have averaged $7.8 billion from 1997 to 2021 according to—and adjusted for inflation by—USDA’s Economic Research Service (USDA-ERS, Farm Income and Wealth Statistics, Government Farm Program Payments, February 7, 2023). Figure 1 illustrates the total Subtitle A program payments from 1997 through USDA’s forecasts for 2022 and 2023, as well as the CBO projections for outlays in Subtitle A programs from FY 2024 to 2033 from the May 2023 baseline. Note that the payments reported by USDA have been adjusted for inflation to Real 2023 dollars by ERS.
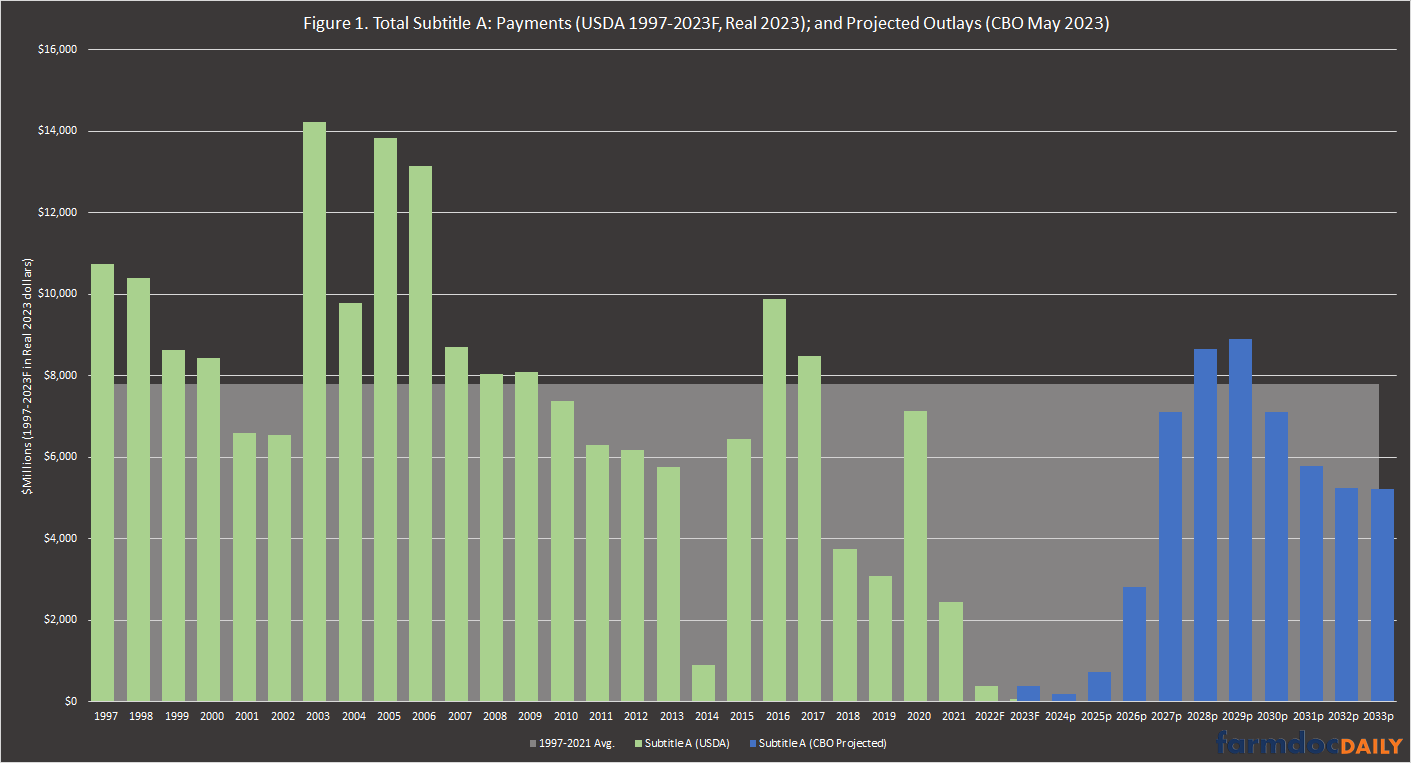
The year 1997 was selected for Figure 1 because Congress decoupled farm program payments from planting decisions and production in the 1996 Farm Bill. Decoupled payments are made on base acres, which are records of previous planted acres and not the actual acres planted (7 U.S.C. §9012). Payments are decoupled in the sense that they are not made based upon actual planting and production decisions. Decoupled payments are less likely to influence farmer planting decisions.
Discussion
Building upon previous discussions, Figure 2 provides an interactive map and other visualizations for ARC and PLC total payments from 2014 to 2021 from the Policy Design Lab. Payments for the 2022 program and crop year have not yet been made because payments use the marketing year average (MYA) price, which pushes payments a year after harvest. In addition, the statutory text requires that no payments be made prior to October 1, which is the start of the federal fiscal year. In a ten-year score, this pushes one fiscal year outside of a ten-year budget window and reduces the CBO cost projections.
Figure 2. Total Commodities Programs Payments from 2014-2021
From 2014 to 2021, the top three states receiving ARC and PLC payments are Texas (9.21% of the national total), Nebraska (6.88%), and Arkansas (6.53%). Kansas (6.45%) and Iowa (6.34%) round out the top five. Selecting ARC changes the map, reporting payments just for that program (both county and individual versions) in 2014 to 2021. From ARC, the top states are Nebraska, Iowa, and Illinois, followed by Minnesota and Indiana. Below the map is further visualized data. Each state’s program performance is displayed in a series of square diagrams known as tree maps. These display the total payments (yellow/gold square), as well as the average base acres (green square) and the average recipients (purple square) for each state. The average payment recipient was calculated by counting the unique names and addresses as reported by FSA (USDA-FSA, Payment Files Information).
Users can hover over each square for details and select a ranking by category (payments, average base acres, or average recipients). The states are ranked by size (from largest to smallest) in the selected category and defaults to total payments. Users can re-rank the states by category or select to display individual categories. This permits further comparison across states. For example, Nebraska received the largest amount of ARC payments ($2.0 billion, 2014-2021) on an average of 10.3 million base acres and 24.8 thousand recipients. By comparison, Iowa also received $2 billion in payments but on 17.5 million average base acres to 33.6 thousand average recipients. Illinois received $1.8 billion in total ARC payments on 16.2 million average base acres and 39.4 thousand average recipients.
For PLC, Texas was the top recipient in terms of total payments at $2.8 billion from 2014 to 2021. Those payments were made on an average of 11.9 million base acres and 37.9 thousand recipients. Arkansas, by comparison, received a total of $2.1 billion in PLC payments but on only 3.2 million average base acres and 13.8 thousand average recipients. Comparing across programs and states, two of the top three states receiving Subtitle A payments benefit mostly from PLC (Texas and Arkansas) while Nebraska received most of its payments through ARC. Kansas might be the most balanced between the two programs, with $1.1 billion in total from ARC and $1.2 billion from PLC.
Concluding Thoughts
If the words of statutes determine the operation of policies and the distribution of benefits, then the Price Loss Coverage (PLC) and Agriculture Risk Coverage (ARC) programs offer straight-forward examples. PLC is designed around fixed statutory reference prices with higher reference prices relative to market prices more likely to trigger payments and produce larger payments. By comparison, the ARC program uses rolling averages and adjusts over time. The guarantee will move up after years of higher prices and then decrease over time if those prices fall over multiple years; at the same time, the guarantee can be impacted by yield losses as compared to historic trends. Toggle the map between ARC-CO and PLC to demonstrate the regional impacts of these different policy designs. ARC-CO benefits are concentrated primarily in the Midwest through the norther Great Plains, while PLC benefits are concentrated in the southern states and North Dakota. As highlighted previously, the differences mostly depend on base acres (how many of which crops) and reference prices (farmdoc daily, June 29, 2023; July 20, 2023; August 3, 2023; August 10, 2023; August 17, 2023). Work continues on a Policy Design Lab being developed at the University of Illinois to apply research, data, computational resources, and statutory or legislative textual analysis to visualize policy design. With a goal of adding further context and perspective to challenging public policy matters, the effort also seeks to generate innovation and creativity in policy design.
References
Abbott, C. “House chairman says 2023 farm bill will be later than expected.” Fern’s Ag Insider. August 14, 2023. https://thefern.org/ag_insider/house-chairman-says-2023-farm-bill-will-be-later-than-expected/.
Caraway, P. “No pressure for 2023 Farm Bill.” Farm Progress.com. August 22, 2023. https://www.farmprogress.com/farm-business/no-pressure-for-2023-farm-bill.
Chow, D. “Sweltering heat descends on Midwest, pushing temperatures to dangerous levels.” NBC News, August 22, 2023. https://www.nbcnews.com/science/science-news/extreme-heat-dome-midwest-temperatures-hot-weather-rcna101153.
Congressional Budget Office. “Baseline Projections: USDA Farm Programs.” May 2023. https://www.cbo.gov/system/files/2023-05/51317-2023-05-usda_0.pdf.
Farmers’ Almanac Staff. “What Are the Dog Days of Summer?” July 24, 2023, https://www.farmersalmanac.com/why-are-they-called-dog-days-of-summer-21705.
Hill, M.L. “Inside the House GOP plan to avoid a farm bill floor catastrophe.” Politico.com. August 9, 2023. https://www.politico.com/news/2023/08/09/house-gop-farm-bill-00110350.
Livingston, I. “Record central U.S. heat wave delivers ‘life threatening’ conditions.” The Washington Post. August 21, 2023. https://www.washingtonpost.com/weather/2023/08/21/record-heat-wave-midwest-south/.
Smith, M., L. Higgins, and A.H. Klein. “Central U.S. Swelters Under Heat Dome, Forcing Cancellations and Precautions.” The New York Times, August 22, 2023. https://www.nytimes.com/2023/08/22/us/heat-wave-midwest-central-weather.html.
Zhong, R. “Warming Set the State for Canada’s Record Fires, Study Finds.” The New York Times. August 22, 2023. https://www.nytimes.com/2023/08/22/climate/canada-wildfires-climate-change.html.
Disclaimer: We request all readers, electronic media and others follow our citation guidelines when re-posting articles from farmdoc daily. Guidelines are available here. The farmdoc daily website falls under University of Illinois copyright and intellectual property rights. For a detailed statement, please see the University of Illinois Copyright Information and Policies here.