A View of the Farm Bill Through Policy Design, Part 3: SNAP
Having enacted a bill to suspend the debt limit and avoid default, Congress can now proceed with other items on its agenda and that could include farm bill reauthorization. This article continues the multi-part series presenting a view of the Farm Bill through the perspective of policy design. The discussion reviews the Supplemental Nutrition Assistance Program (SNAP) reauthorized in Title IV of the Agricultural Improvement Act of 2018. SNAP is the subject of intense partisan focus, largely due to the amount of annual spending for the program (farmdoc daily, April 20, 2023; April 27, 2023). The Congressional Budget Office projects that SNAP will spend almost $1.2 trillion in the baseline, or approximately $120 billion per year for ten fiscal years (FY) from FY2024 to FY2033 (farmdoc daily, February 23, 2023; CBO, February 2023; CBO, May 2023). In FY2022, USDA’s Food and Nutrition Service (FNS) reported $119 billion in total program costs, $113.9 billion of which was for benefits, to provide assistance to a monthly average of 41.2 million Americans (USDA, FNS SNAP Data Tables: National Level Annual Summary).
Background
The articles in this series will explore the major mandatory titles, policies, and programs in the Farm Bill, as well as updates on the Policy Design Lab project (farmdoc daily, April 13, 2023; May 11, 2023). A work-in-progress, the Policy Design Lab provides a web-based resource in which to explore and analyze existing policies and policy alternatives, working from statutory and legislative text to incorporate and apply research, publicly available data, and computational resources for analysis and visualization efforts; research and data guided by statutory provisions or legislative options to produce comparative analysis. One goal will be to advance understanding about existing policy outcomes, as well as research-backed potential outcomes of alternative designs. Eventually, it will also seek to improve understanding of the policymaking process and facilitate open discussions about policy options. For each of the major mandatory farm bill programs, the status quo will be visualized through maps and charts of the distribution of benefits and payments by State. This installment explores the policies and spending of the Supplemental Nutrition Assistance Program (SNAP).
Discussion
By any measure, SNAP is the largest program in the Farm Bill. It constitutes nearly 85% of the projected spending or baseline, while also serving a constituency that is more than 20 times that of farm programs or crop insurance. In the statute, SNAP is housed in chapter 51 of Title 7, which is the Agriculture Title of the U.S. Code. As noted above, most of the spending on SNAP is for benefits and that spending effectively is the function of two provisions: (1) eligibility provisions that provide for participation in the program; and (2) benefit calculations that provide for the amount received by participants.
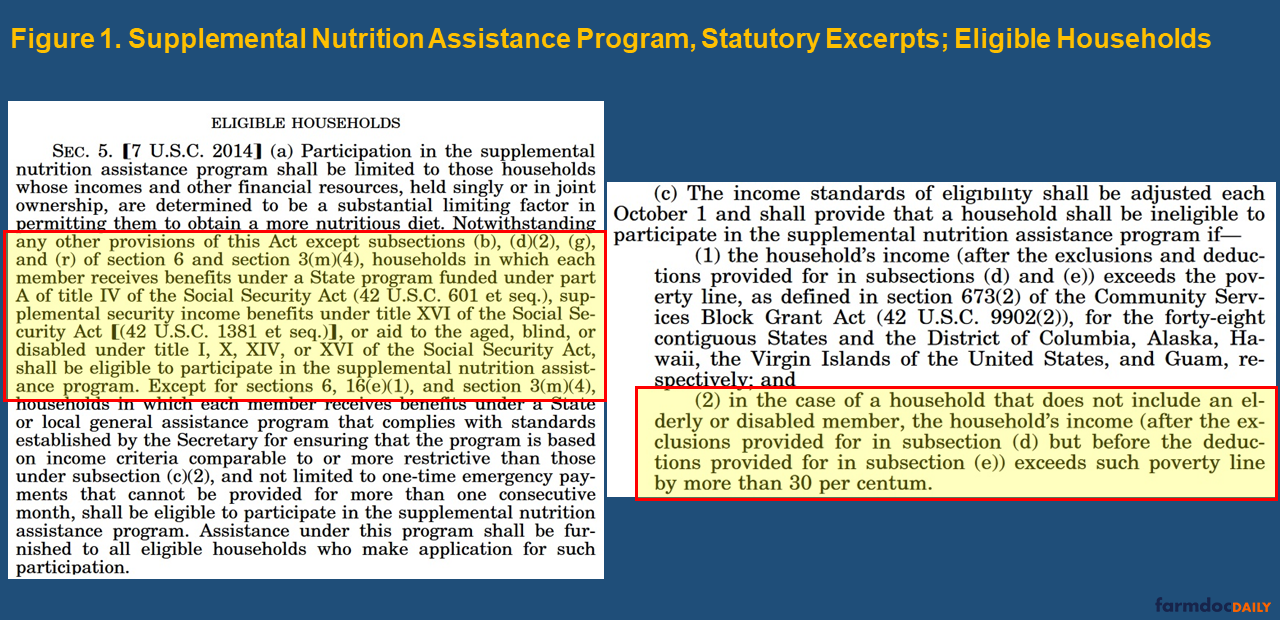
Figure 1 contains excerpts from the SNAP statutory compilation for determining household eligibility (Senate ANF, Compilations: Food and Nutrition Act of 2008). Two provisions are highlighted: what is known as categorical eligibility, in which a household is eligible for SNAP because they are also eligible for other federal low-income assistance programs; and the income standards for households, generally understood as gross monthly household income at or below 130% of the federal poverty level (7 U.S.C. §2014). In addition, household net monthly income must be at or below 100% of the federal poverty level (CRS, October 4, 2022).
Benefits to eligible households are determined based by calculations through the thrifty food plan and can only be used to purchase food (7 U.S.C. §2017). The definition of the thrifty food plan is based on diet needs for a household of four using current food prices, food composition data, consumption patterns and dietary guidelines (7 U.S.C. §2012). USDA FNS reported that the average benefit per participating person each month was just over $230 in FY 2022—that would amount to less than $8 per day, or about $2.50 per meal. CBO projects the average monthly benefit per participating person to be $222 in FY2023 and increase to $265 by FY2033. As noted above, most of the costs of SNAP are from benefits, which is largely a function of the number of people receiving assistance and the amount of that assistance. For example, $222 per person for 41.2 million persons in FY2022 comes out to approximately $9.5 billion per month in benefits, nearly $114 billion for the year. The remaining $5 billion would be operational costs of the program, including things like employment and training efforts.
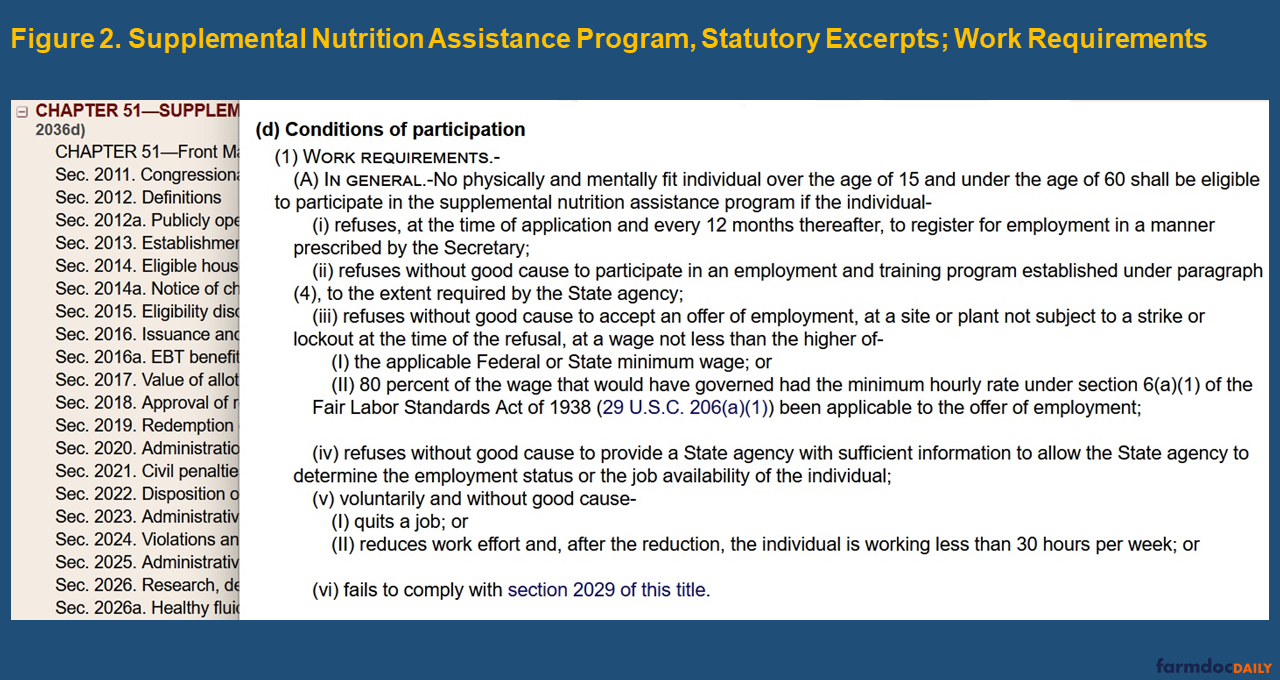
As discussed previously, the debt limit negotiations included changes to the work requirements for SNAP. In the statute, the work requirements provisions are contained within the section for eligibility disqualifications (7 U.S.C. §2015). Figure 2 provides the work requirements excerpts from the statute; note, however, that these provisions have yet to be updated due to enactment of the debt limit bill. Little about the debate over revising work requirements, nor the final changes to the program, answered the most significant question about this policy: since the 2008 financial crisis, there has been a clear divergence between SNAP participation and unemployment, likely indicating that many people are employed but still falling below poverty measures (farmdoc daily, April 20, 2023).
Figure 3 presents an interactive map for SNAP based on the total costs by State for FY 2018 to FY 2022. The map also presents the average monthly participation for the State in those years. For example, SNAP spent a total of $19.6 billion in Illinois in those years and the monthly average participation was nearly 1.9 million people. Scrolling further down is an interactive chart that provides each state’s spending and participation, as well as the percentage of the national total, ranking the states from most (California: $45.8 billion; 4.15 million people) to least (Wyoming: $265 million; 28,000 people). The chart can be converted to a table as well. Also note that in the legend above the map, the color bars are different lengths representing the number of states within each category of costs; most states, by this estimate, receive between $5 billion and $10 billion in SNAP spending from FY 2018 to FY 2022.
Figure 3. Total Supplemental Nutrition Assistance Program (SNAP) Costs from 2018 – 2022
Concluding Thoughts
The words of statutes put policies in action, including determining the distribution of benefits. The Supplemental Nutrition Assistance Program (SNAP) reviewed in this article also provides a good example of program complexity; the many cross-statutory references in the eligibility provisions for one, as well as the provisions for work requirements that can operate to disqualify people from participation. SNAP also provides another example and an important reminder about a fundamental reality of policy: on the other end of the statutory words, the USDA data, and the Congressional Budget Office spending projections are real people. In the case of SNAP, these are people with incomes below basic poverty measures and households struggling to put food on the table. In the United States today, with historically low unemployment there are on average more than 41 million Americans each month who qualify and receive assistance from this program. If the primary view of the program is through the CBO projections, that view is circumscribed by a bottom-line projection of $120 billion each year and $1.2 trillion over ten years; at the level of the individual getting help to buy food, the program provides about $8 each day and $230 each month. Reducing the costs of the program to any significant degree requires reducing the number of people who can receive assistance. For those individuals and households, losing this modicum of assistance does not help them with the struggles of poverty, it only magnifies them. Moreover, spending projections ten years into an unknown future are not reality, but losing assistance to buy food is a difficult reality on a daily basis. It is the juxtaposition of these two perspectives that defines much of the politics of SNAP—and through SNAP for any farm bill reauthorization—but also causes those politics to become pointed and challenging. Reviewing the program’s parameters and its distribution of benefits and participation also provides important political context. A Policy Design Lab being developed at the University of Illinois is working to apply research, data, computational resources, and statutory or legislative textual analysis to visualize policy design, with a goal of adding further context and perspective to challenging public policy matters.
References
Coppess, J. "A View of the 2023 Farm Bill from the CBO Baseline." farmdoc daily (13):33, Department of Agricultural and Consumer Economics, University of Illinois at Urbana-Champaign, February 23, 2023.
Coppess, J. "The House Debt Ceiling Bill and the 2023 Farm Bill Reauthorization Debate." farmdoc daily (13):78, Department of Agricultural and Consumer Economics, University of Illinois at Urbana-Champaign, April 27, 2023.
Coppess, J. and A. Knepp. "A View of the Farm Bill Through Policy Design, Part 2: CSP." farmdoc daily (13):86, Department of Agricultural and Consumer Economics, University of Illinois at Urbana-Champaign, May 11, 2023.
Coppess, J. and A. Knepp. "A View of the Farm Bill Through Policy Design, Part 1: EQIP." farmdoc daily (13):69, Department of Agricultural and Consumer Economics, University of Illinois at Urbana-Champaign, April 13, 2023.
Coppess, J. and M. White. "Farm Bill 2023: Questions About the Focus on SNAP Work Requirements." farmdoc daily (13):73, Department of Agricultural and Consumer Economics, University of Illinois at Urbana-Champaign, April 20, 2023.
Coppess, J. and M. White. "Farm Bill 2023: Questions About the Focus on SNAP Work Requirements." farmdoc daily (13):73, Department of Agricultural and Consumer Economics, University of Illinois at Urbana-Champaign, April 20, 2023.
Disclaimer: We request all readers, electronic media and others follow our citation guidelines when re-posting articles from farmdoc daily. Guidelines are available here. The farmdoc daily website falls under University of Illinois copyright and intellectual property rights. For a detailed statement, please see the University of Illinois Copyright Information and Policies here.


