


The Relative Impact of Crop Weather Variables on the U.S. Average Yield of Corn
A perennial question in the grain markets is the impact of weather during different parts of the growing season on final yield. While every growing season is unique in some respects, it is well-known that weather during certain periods is generally a more important determinant of final yield than others, with the crucial reproductive periods for corn and soybeans a prominent example. What is not as well-known is the relative magnitude of such impacts. In other words, how much more important is the impact of weather in, say, June versus August? Answering this question requires a statistical model to disentangle the impacts of the different weather variables that influence yield. The purpose of today’s article is to use a regression crop weather model to estimate the relative impacts of important weather variables on the U.S. average yield of corn.
Analysis
We begin by estimating a “Thompson-style” crop weather regression model that relates the U.S. average corn yield to a time trend, the percentage of the crop planted late, and an array of weather variables. The model is a slightly modified version of one used in several earlier farmdoc daily articles (May 13, 2020; June 25, 2020; July 16, 2020). While many other specifications can, and have been, used in the literature (see Tannura, Irwin, and Good, 2008), this model has been shown to be reasonably accurate and captures the main crop weather factors that influence the U.S. average yield of corn. The version of the model estimated here uses data for 1980 through 2022 and includes the following explanatory variables: i) a linear time trend variable to represent technological change, ii) the percentage of the corn crop planted late, iii) linear functions of preseason (September-March), April, and August precipitation, iv) quadratic functions of June and July precipitation, and v) linear functions of April, May, June, July, and August temperatures. The late planting variable is defined as the percentage of U.S. corn acreage planted after May 30th from 1980 through 1985 and after May 20th from 1986 onwards. This is the same late planting variable analyzed in earlier farmdoc daily articles (e.g., April 28, 2022).
The monthly weather data are collected for 10 key corn-producing states (Iowa, Illinois, Indiana, Minnesota, Missouri, Nebraska, North Dakota, Ohio, South Dakota, and Wisconsin). These 10 states typically accounted for about 75-80 percent of total U.S harvested acreage of corn during the sample period. An aggregate measure for the 10 states was constructed using harvested corn acres to weight state-specific observations. The weighted-average monthly weather variables are used to represent weather observations for the entire U.S. corn crop, similar to the procedure used by the World Agricultural Outlook Board of the USDA for estimating their crop weather model (farmdoc daily, July 2, 2020). Precipitation data are monthly totals and temperature data are monthly averages. The National Weather Service is the source for the weather data via the Midwest Regional Climate Center.
Table 1 presents the regression estimates for the crop weather model. The model has a high explanatory power, with an R2 of 98 percent. The signs of the coefficient estimates are as expected. The time trend coefficient indicates that the trend rate of growth in the U.S. average corn yield over this time period was slightly less than two bushels per year. A quadratic time trend term was also considered but the quadratic term was not statistically significant. Each percentage of the U.S. corn crop planted late is estimated to reduce corn yield by 0.34 bushels per acre. The crop weather variables are statistically significant at the ten percent level or better except for pre-season precipitation and April-June temperature.

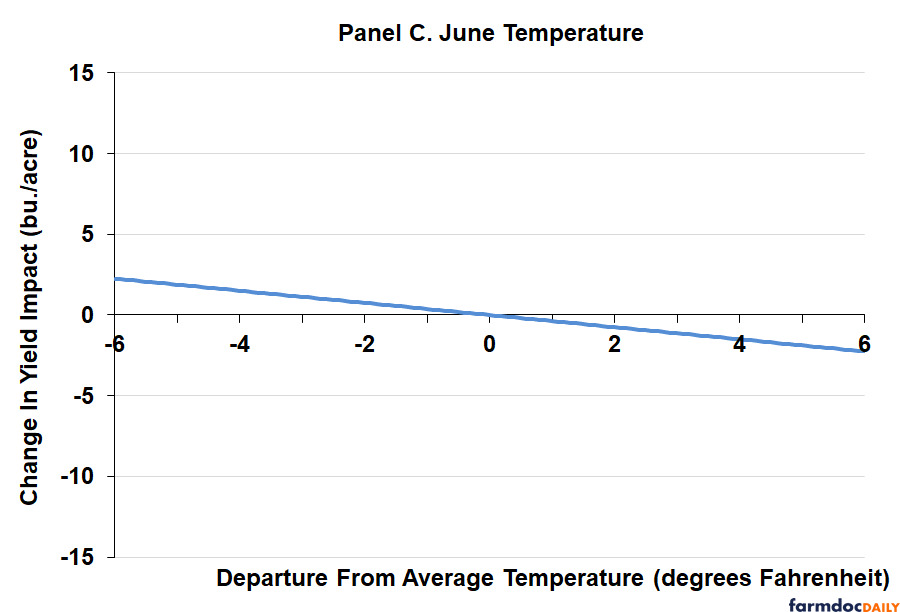
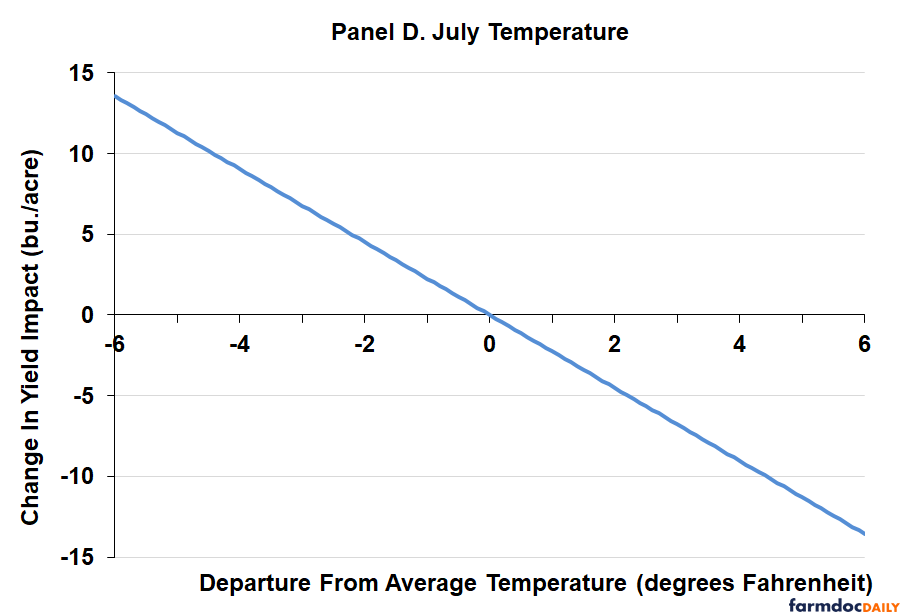
Since it is difficult to interpret the coefficient estimates directly, particularly for the quadratic precipitation variables, Figures 1 and 2 plot the estimated relationships for each variable. The “hill-shaped” response of corn yield to June and July precipitation is highlighted in Figure 1, along with the large response of yield to July precipitation. Note that the scale in the plot for July precipitation is different than for the other precipitation plots. Figure 2 plots the response of corn yield to the temperature variables. Note that the change in yield relative to departure from average temperature per month is plotted to simplify the presentation. The early season response to temperature in April and May is positive, while the response in June through August is negative. The largest response to temperature is in July and August.
Figure 1. Estimated Response of U.S. Corn Yield to Late Planting and Precipitation Variables, 1980-2022
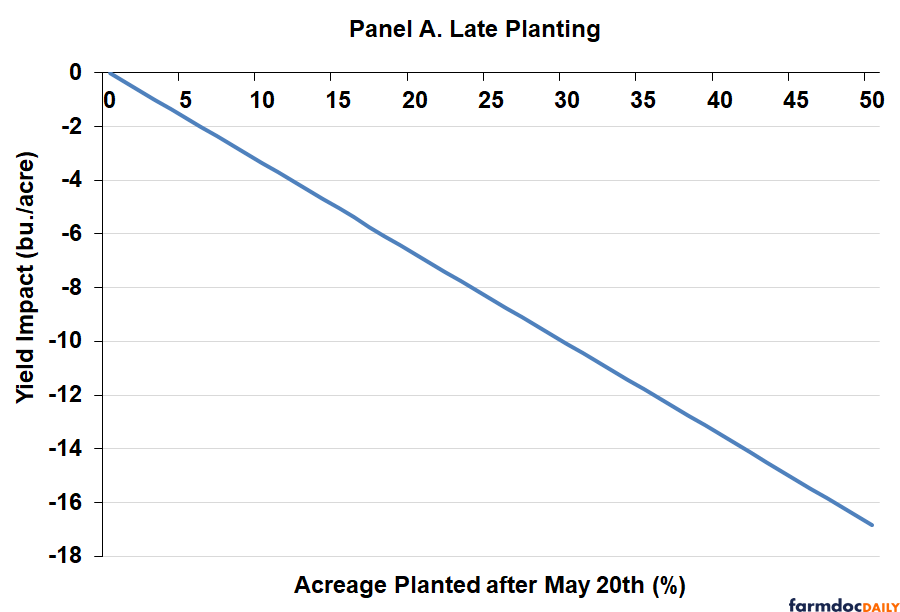

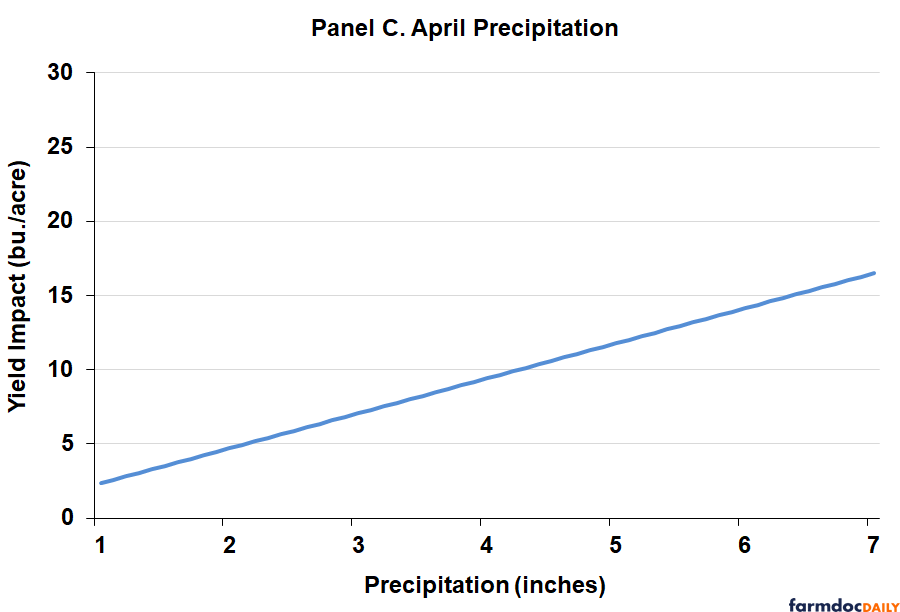


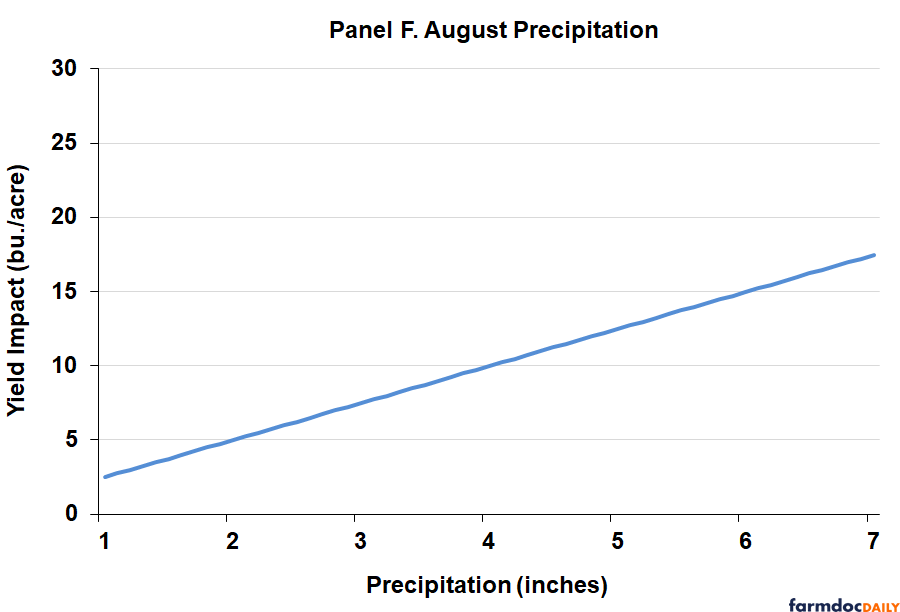
Figure 2. Estimated Response of U.S. Corn Yield to Temperature Variables, 1980-2022


While the plots in Figures 1 and 2 provide a useful perspective on the response of the U.S average corn yield to crop weather variables, the plots do not tell the entire story. The reason is that the variation of the weather variables is not uniform. Table 2 demonstrates the point. Here, descriptive statistics for each variable are presented. The crucial information is provided by the coefficient of variation (COV), which is the standard deviation divided by the mean. This shows the dispersion of a variable as a percentage of its mean, or average. Standardizing in this manner reveals some interesting patterns. By far the most volatile variable is late planting, which has a COV of 63.8 percent. The COV for monthly precipitation variables ranges between about 27 and 30 percent by comparison. The variability of monthly temperatures is even smaller, roughly in the range of only three to six percent. The picture that emerges is that temperature varies relatively little compared to average levels, while precipitation and late planting are much more volatile.

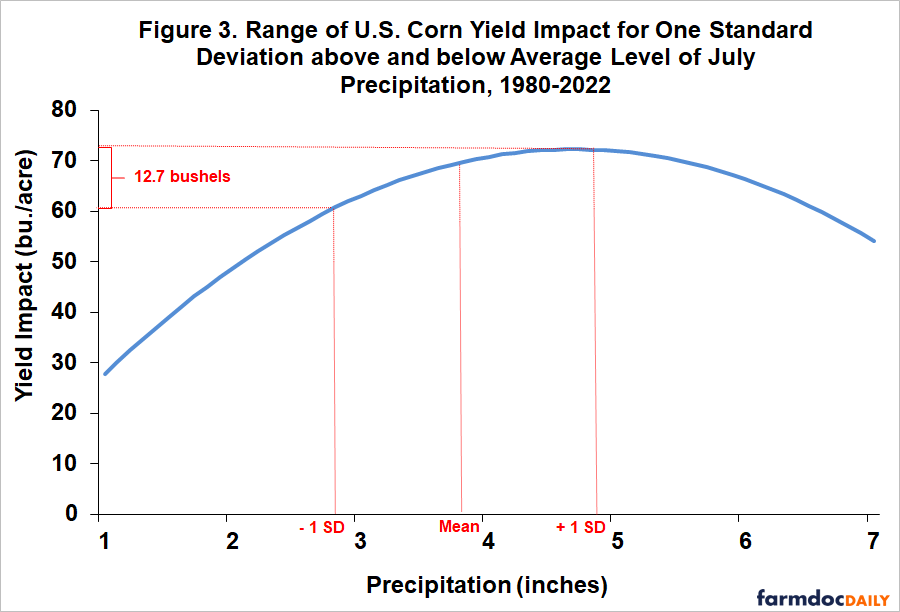
The information presented in Table 2 indicates that analysis of the relative importance of crop weather variables on the yield of corn needs to consider both the nature of the relationship between the variables and yield and the inherent difference in the variation of the variables. Figure 3 uses July precipitation to demonstrate the procedure adopted here. This is the same relationship shown earlier in Panel E of Figure 1. In order to standardize for the differences in variability, a one-standard deviation range above and below the mean is considered. This should roughly include about two-thirds of the observations for each variable. In the case of July precipitation, one standard deviation below mean precipitation for the month is associated with a 60-bushel impact on yield, whereas one standard deviation above mean precipitation is associated with a 72.7 bushel impact on yield. The net result is that the U.S. average yield of corn varies by 12.7 bushels per acre for a one-standard deviation range in July precipitation. Alternatively, one can say that about two-thirds of the time the impact of July precipitation on the U.S. average yield of corn is within a range of 12.7 bushels.
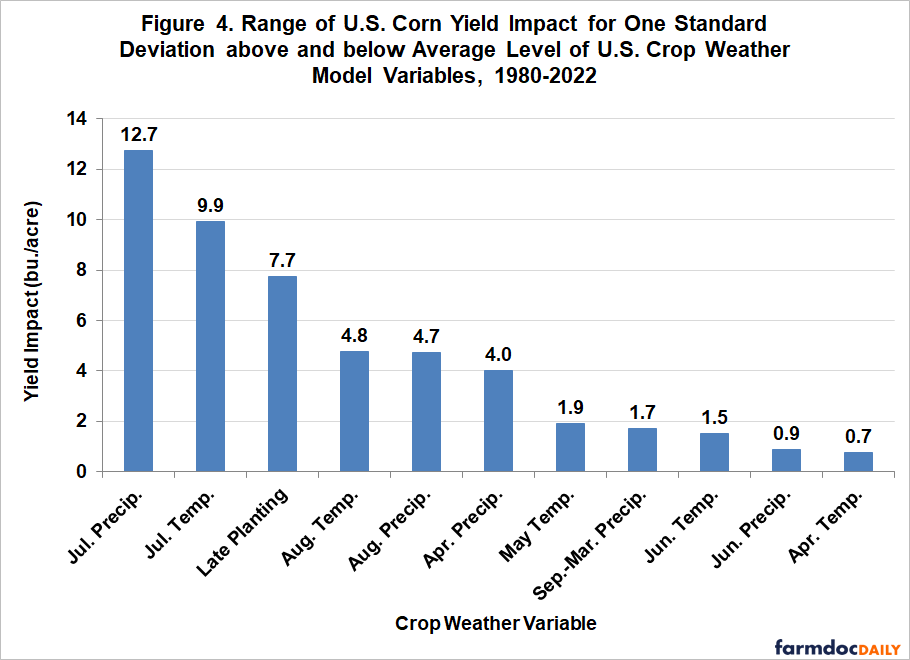
The same computations as in Figure 3 were made for each of the crop weather variables included in the model. The results are presented in Figure 4. Not surprisingly, July precipitation is easily the most important variable influencing the U.S. average yield of corn through time. The second most important variable is July temperature with a range of 9.9 bushels per acre. Some may be surprised by the importance of late planting, which has a range of 7.7 bushels. While the impact of each percentage point increase in late planting is small, the variability of late planting year-to-year is quite large, as shown earlier in Table 2. Hence, the wide range of late planting year-to-year accounts for its relatively large impact. August temperature and precipitation along with April precipitation form the next group of variables, with ranges between 4.0 and 4.8 bushels. All of the remaining crop weather variables have ranges less than two bushels. In sum, the “big three” for determining the U.S. average yield of corn are July precipitation, July temperature, and late planting, with July precipitation taking the lead.
Implications
There is never a shortage of discussion about the impacts of growing season weather on the U.S. average yield of corn. This year is a great example with a wide range of conditions across space and time. While there is a general understanding of the importance of different weather variables on corn yield, there is less understanding about the relative magnitude of such impacts. Here, we use a crop weather model to estimate the relative impacts of important weather variables on the U.S. average yield of corn. The crop weather regression model uses data for 1980 through 2022 to relate the U.S. average corn yield to a time trend, the percentage of the crop planted late, and an array of weather variables. We then consider a one-standard deviation range in impact for each of the crop weather variables to standardize for differences in the variation of each variable. The analysis shows that July precipitation is easily the most important variable influencing the U.S. average yield of corn through time. About two-thirds of the time, the impact of July precipitation on the U.S. average yield of corn is in a range of nearly 13 bushels per acre. The second most important variable is July temperature and the third most important is late planting. The bottom-line is that July precipitation truly is the “golden number” for U.S. corn yields.
References
Irwin, S. "What Do We Know About the Impact of Late Planting on the U.S. Average Corn Yield?" farmdoc daily (12):59, Department of Agricultural and Consumer Economics, University of Illinois at Urbana-Champaign, April 28, 2022.
Irwin, S. and T. Hubbs. "The Accuracy of Early Season Crop Weather Model Forecasts of the U.S. Average Corn Yield." farmdoc daily (10):131, Department of Agricultural and Consumer Economics, University of Illinois at Urbana-Champaign, July 16, 2020.
Irwin, S. and T. Hubbs. "Understanding the WAOB Crop Weather Model for Corn." farmdoc daily (10):121, Department of Agricultural and Consumer Economics, University of Illinois at Urbana-Champaign, July 2, 2020.
Irwin, S. and T. Hubbs. "Unconditional vs. Conditional Trend Estimates for U.S. Corn and Soybeans." farmdoc daily (10):116, Department of Agricultural and Consumer Economics, University of Illinois at Urbana-Champaign, June 25, 2020.
Hubbs, T. and S. Irwin. "The Impact of Late Planting on U.S. Average Corn Yield." farmdoc daily (10):88, Department of Agricultural and Consumer Economics, University of Illinois at Urbana-Champaign, May 13, 2020.
Tannura, M. A., S. H. Irwin, and D. L. Good. “Weather, Technology, and Corn and Soybean Yields in the U.S. Corn Belt.” Marketing and Outlook Research Report 2008-01, Department of Agricultural and Consumer Economics, University of Illinois at Urbana-Champaign, February 2008.
Disclaimer: We request all readers, electronic media and others follow our citation guidelines when re-posting articles from farmdoc daily. Guidelines are available here. The farmdoc daily website falls under University of Illinois copyright and intellectual property rights. For a detailed statement, please see the University of Illinois Copyright Information and Policies here.