Where Might Nitrogen Fertilizer Prices Be Headed?
After record farm incomes in 2021 and 2022, commodity prices have declined while input costs have remained elevated resulting in a margin squeeze and much lower incomes in 2023 and projected for the current 2024 crop year. Fertilizer prices have been a major area of interest and concern over the past few crop years, reaching historic highs in 2022 and exhibiting increased volatility relative to historical experience over the past decade (see farmdoc daily articles from June 13, 2023, August 15, 2023, and September 19, 2023).
In today’s article we revisit a statistical regression model fit to monthly anhydrous ammonia prices reported in Illinois. Historically there exists a strong positive correlation between anhydrous prices, corn prices, and natural gas prices. Current corn and natural gas prices levels suggest anhydrous ammonia prices could continue to trend downward from recent averages of around $800 per ton to $700 per ton later this fall. Futures market expectations would suggest a smaller decline to around $750 per ton this fall. However, returns to higher natural gas and/or corn prices could result in anhydrous prices at current or higher levels this fall while lower corn and natural gas prices could support even greater further declines for anhydrous prices.
Explaining Nitrogen Prices
We use a simple regression model to explain the variation in monthly anhydrous ammonia prices reported for Illinois from the USDA (USDA-AMS). The relationship between anhydrous ammonia, corn, and natural gas prices, and the regression model discussed below has been covered in previous articles (see farmdoc daily articles from June 4, 2016 and December 14, 2021)
The model includes monthly national corn prices (USDA-NASS) and natural gas prices at the Henry Hub (EIA). Anhydrous ammonia prices are positively correlated with both corn and natural gas prices (see Figure 1). The correlation between anhydrous and natural gas prices since 2008 is 0.54; the correlation between anhydrous and corn prices has been 0.75.
Higher corn prices result in greater demand for nitrogen fertilizer products as corn acres increase and higher farm incomes support higher input prices. Higher natural gas prices are a major input to the production of synthetic nitrogen fertilizers and thus also tend to result in higher prices for nitrogen fertilizer products.
A lagged anhydrous ammonia price (price from the previous month) is also included in the regression. The lagged price controls for market dynamics and adjustment in fertilizer prices. Adjustment periods can be driven by a number of factors. For example, fertilizer companies likely do not make instantaneous adjustments based on spot price movements in a given month. Pricing, procurement, and production decisions are likely made based on longer-run trends and expectations as well as contracting arrangements that will naturally result in adjustment periods for prices.
Based on data from September 2008 through April 2024, the estimated regression equation is given by:
Predicted Anhydrous Ammonia Price = -5.68 + 6.67*Natural Gas Price
+ 8.31*Corn Price +0.92*Lagged Anhydrous Ammonia Price
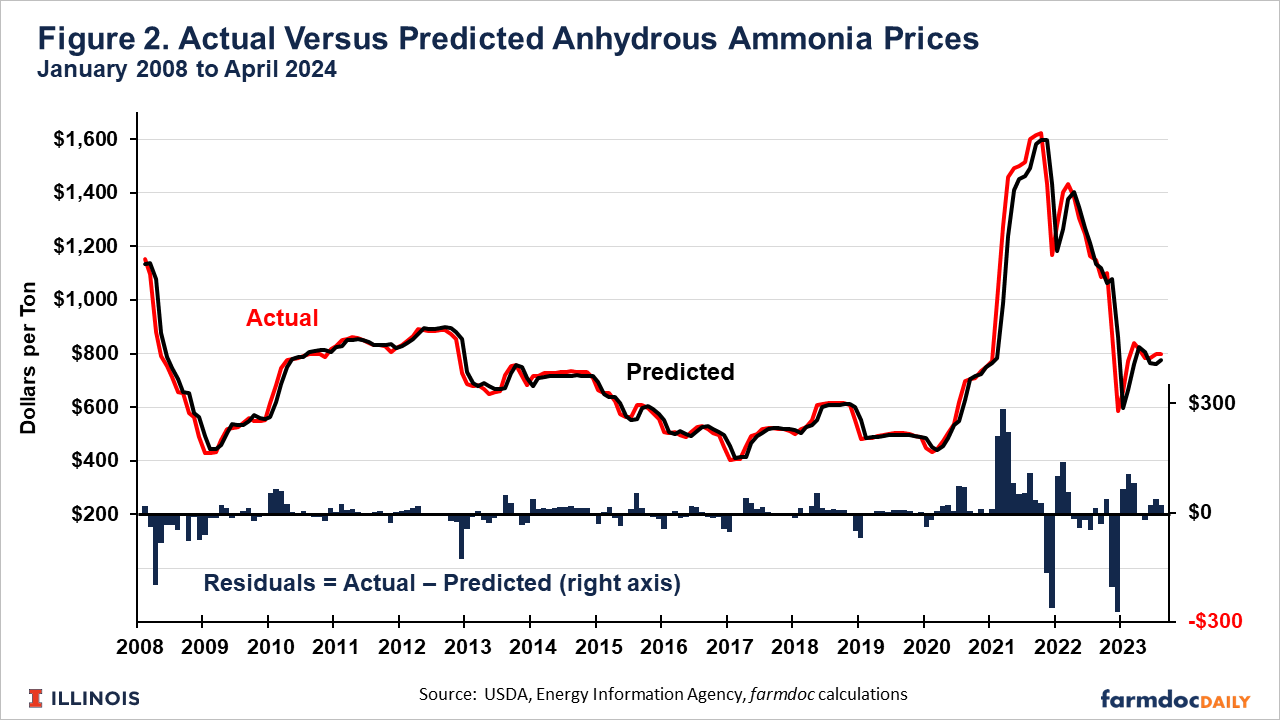
As shown in Figure 2, the estimated regression has a good fit, explaining 95% of the variation in monthly anhydrous ammonia prices in Illinois (R2 = 0.95). Differences between actual and predicted anhydrous prices, referred to as a residual in regression analysis, are largest during periods of fast and extended price movements – multiple months of quickly rising or falling prices.
The residuals are plotted over time in the lower portion of Figure 2. There were relatively large variations between actual and predicted anhydrous prices in late 2008 as fertilizer prices declined rapidly during the financial crisis. Differences between actual and predicted prices were relatively small from 2010 until fall of 2021, a period over which fertilizer price movements were also relatively stable. Deviations between actual and predicted prices have again been higher since the fall of 2021 as fertilizer prices have been higher and exhibited more volatility over the past 3 years (see farmdoc daily article from September 19, 2023).
Where are Fertilizer Prices Headed?
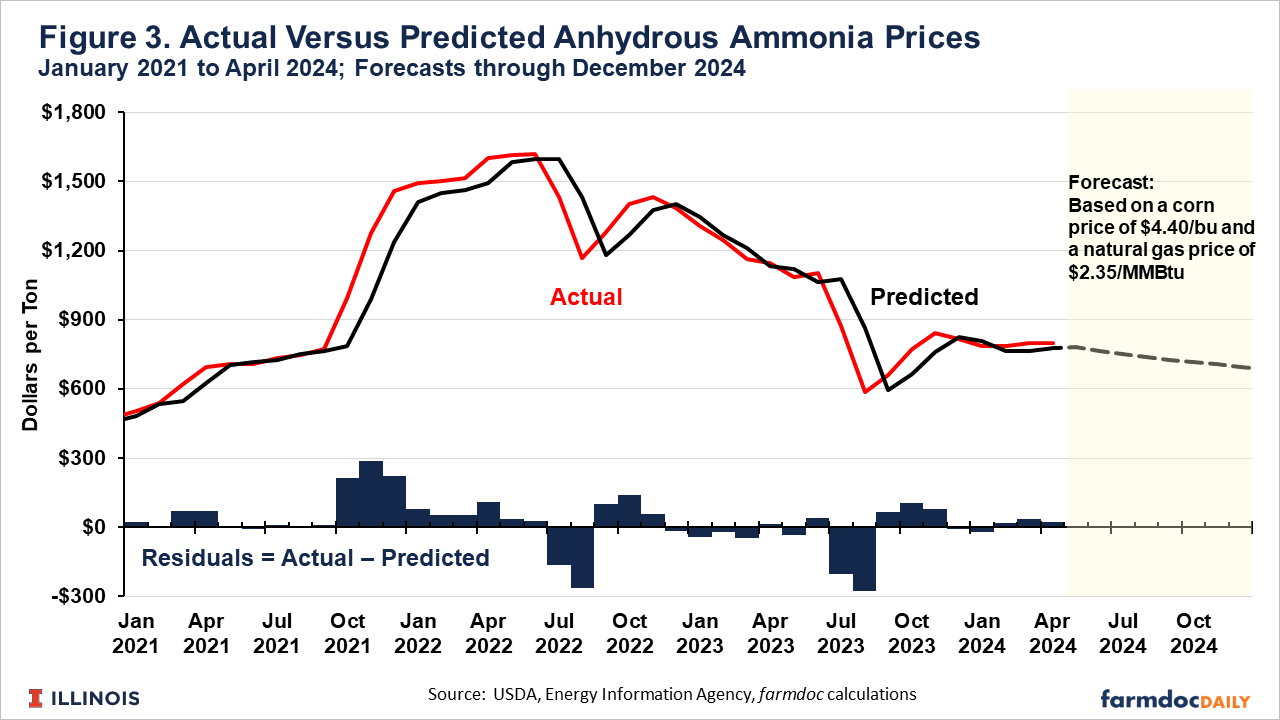
Figure 3 focuses on actual and predicted anhydrous prices since the beginning of 2021, and includes a forecast scenario based on natural gas and corn prices holding steady around current levels.
The fitted regression relationship suggests that, at current corn and natural gas prices, anhydrous ammonia prices should be expected to continue to decline over the coming months. If corn prices remain around $4.40 per bushel and natural gas prices remain around $2.35 per million British thermal units (MMBtu), the price model suggests anhydrous prices would continue to decline to around $700 per ton by later this fall.
Natural gas futures suggest rising prices over the coming months, returning to between $3 and $4 per MMBtu. Corn futures suggest cash corn prices are expected to remain in the low to mid $4 per bushel range over the next 6 months. Natural gas prices of $3.50 per MMBtu and corn prices of $4.50 per bushel would result in an anhydrous price forecast of around $750 per ton later this fall. Natural gas prices at $4 and corn prices at $5 would be expected to result in anhydrous prices remaining in the $800 per ton range through this fall. Natural gas prices of $2.00 per MMBtu (note, monthly spot prices were below this level in February, March, and April of 2024) and a corn price of $4.00 per bushel would suggest anhydrous prices converging to the mid $600 per ton range this fall.
Summary
Corn and natural gas prices can help explain nitrogen fertilizer prices. Historically, nitrogen fertilizer prices have been positively correlated with prices for both corn and natural gas. Current corn and natural gas prices suggest fertilizer prices may continue to decline into the fall as farmers begin to consider their fertilizer purchases for the 2025 crop.
If current corn and natural gas prices hold ($4.40 per bushel and $2.35 per MMBtu), average anhydrous ammonia prices in Illinois could decline to around $700 per ton, based on the historical fundamental relationships among these markets. Futures markets for natural gas and corn suggest the potential for increased prices in the coming months that would support anhydrous prices around $750 per ton.
Higher corn and natural gas prices ($5 per bushel and $4 per MMBtu) would suggest anhydrous prices remain at current levels, around $800 per ton, into the fall. Lower corn and natural gas prices ($4 per bushel and $2 per MMBtu) would be expected to push anhydrous prices lower into the mid $600 per ton range.
References
Energy Information Administration (EIA). Henry Hub Natural Gas Spot Prices. https://www.eia.gov/dnav/ng/hist/rngwhhdm.htm
Schnitkey, G. "Anhydrous Ammonia, Corn, and Natural Gas Prices Over Time." farmdoc daily (6):112, Department of Agricultural and Consumer Economics, University of Illinois at Urbana-Champaign, June 14, 2016.
Schnitkey, G., N. Paulson, C. Zulauf, K. Swanson and J. Baltz. "Nitrogen Fertilizer Prices Above Expected Levels." farmdoc daily (11):165, Department of Agricultural and Consumer Economics, University of Illinois at Urbana-Champaign, December 14, 2021.
Schnitkey, G., N. Paulson, C. Zulauf and J. Baltz. "Nitrogen Fertilizer Prices Stabilize at High Levels in Spring 2023." farmdoc daily (13):108, Department of Agricultural and Consumer Economics, University of Illinois at Urbana-Champaign, June 13, 2023.
Paulson, N., G. Schnitkey, C. Zulauf, J. Colussi and J. Baltz. "Fertilizer Prices Continue Decline and May Impact Farmers’ Nitrogen Decisions." farmdoc daily (13):150, Department of Agricultural and Consumer Economics, University of Illinois at Urbana-Champaign, August 15, 2023.
Paulson, N., C. Zulauf, G. Schnitkey, J. Colussi and J. Baltz. "Variability in Nitrogen Fertilizer Prices in Illinois Over the Last 15 Years." farmdoc daily (13):170, Department of Agricultural and Consumer Economics, University of Illinois at Urbana-Champaign, September 19, 2023.
USDA Agricultural Marketing Service (USDA-AMS). Illinois Production Cost Report. https://mymarketnews.ams.usda.gov/viewReport/3195
USDA National Agricultural Statistics Service (USDA-NASS). Quickstats Database. https://quickstats.nass.usda.gov/
Disclaimer: We request all readers, electronic media and others follow our citation guidelines when re-posting articles from farmdoc daily. Guidelines are available here. The farmdoc daily website falls under University of Illinois copyright and intellectual property rights. For a detailed statement, please see the University of Illinois Copyright Information and Policies here.


