


The Liquidity of Illinois Grain Farms: Working Capital to Gross Farm Returns Ratio
In this article, we continue our series examining the liquidity of Illinois grain farms, building upon our recent analyses (see farmdoc daily, November 14, 2024, October 31, 2024, December 4, 2023). Liquidity describes a farm business’s ability to generate sufficient cash or to quickly convert assets into cash to meet its financial obligations as they come due, which include operational expenses, debt payments, family living expenses, and taxes. Using data from the Illinois Farm Business Farm Management (FBFM), we now focus our analysis on the annual working capital to gross farm returns ratio trends for grain farms. This ratio measures the amount of working capital the farm has relative to its size in terms of farm returns. Working capital is defined as the difference between current assets (i.e., cash and assets expected to be converted into cash within the next 12 months, including accounts receivable, inventory, and prepaid expenses) and current liabilities (i.e., obligations due within the next 12 months, such as accounts payable, short-term loans, and upcoming taxes). Gross farm returns are defined as the total value of agricultural output, including Government farm program payments. A farm with a working capital to gross farm returns ratio of 0.4 means that it has enough “cash” to replace 40% of gross farm returns in that year.
Our analysis also presents the financial quality of the ratio. According to the Farm Financial Scorecard developed by the Center for Farm Financial Management, a farm with a working capital to gross farm returns ratio that is less than 0.1 is categorized as vulnerable, a ratio between 0.1 and 0.3 is categorized as cautionary, and a ratio that is greater than 0.3 is categorized as strong.[1] Therefore, the higher the ratio, the more liquid the farm is. Lastly, in our figures below, we use the color-coding system of the Farm Financial Scorecard to indicate the category under which the median grain farm’s ratio belongs. The region shaded in red indicates a vulnerable ratio, while yellow indicates a cautionary ratio, and green indicates a strong ratio.
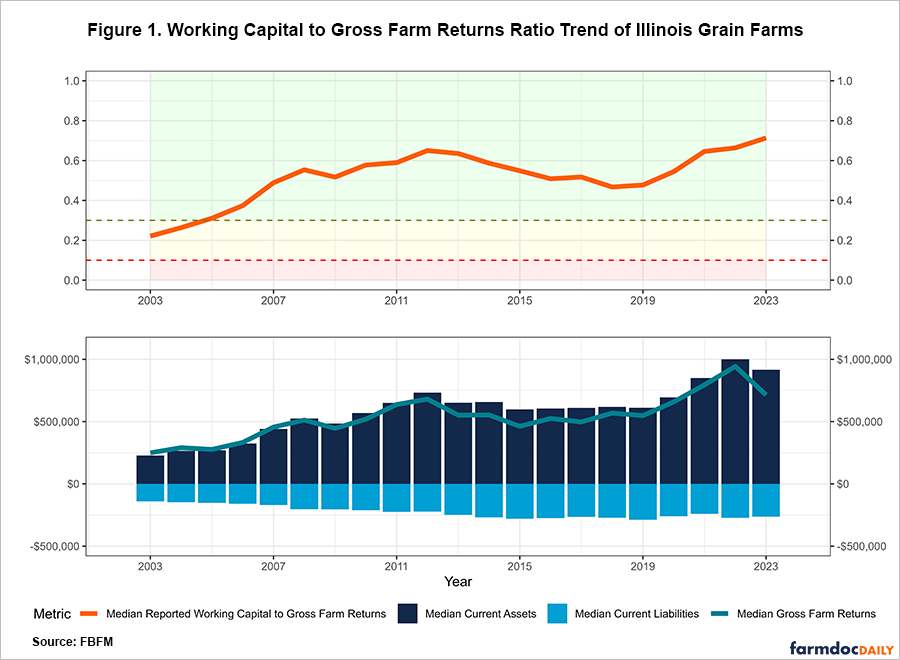
Figure 1 shows the median value of current assets, current liabilities, gross farm returns, and the reported working capital to gross farm returns ratio of grain farms in Illinois. Despite the notable decline during the 2014-2019 period, the overall ratio across all Illinois grain farms has trended upward over the past two decades. In 2003, the reported working capital to gross farm returns ratio was 0.2212 (cautionary). In that year, median current assets were $227,968, whereas median current liabilities were $140,491, and median gross farm returns were $249,097. By 2012, median current assets had increased by 221.35% to $732,583.50, median current liabilities had increased by 58.59% to $222,809, and median gross farm returns had increased by 173.14% to $680,381. These underlying changes contributed to the reported working capital to gross farm returns ratio improving significantly, increasing to 0.6502 (strong). The strong growth in current assets over this period was due to increases in grain prices, which resulted in higher ending inventory values.
However, from 2013 to 2019, the reported working capital to gross farm returns ratio declined substantially but remained strong, falling from 0.6502 (strong) to 0.4773 (strong). During this period, incomes decreased due to lower grain prices and higher costs. As a result, current assets declined while current liabilities increased. However, incomes rebounded in 2020 and subsequent years. Median gross farm returns and median current assets peaked in 2022 at $942,912 and $1,000,946, respectively. Although gross farm returns fell in 2023, the median reported working capital to gross farm returns ratio continued to improve, increasing from 0.6638 (strong) to 0.7134 (strong). This was because, at the median, the decline in gross farm returns was larger than the decline in working capital.
Conclusion
Our analysis of Illinois grain farms’ working capital to gross farm returns ratios reveals substantial improvements in farm liquidity over the past two decades. Despite experiencing a notable decline between 2014 and 2019, the median ratio has shown resilience, progressing from a cautionary level of 0.2212 in 2003 to a strong level of 0.7134 in 2023. Overall, this trend reflects both structural changes in farm balance sheets and the impact of market conditions on the liquidity of Illinois grain farms. As we enter 2025, the continued monitoring of liquidity measures remains crucial as farms navigate evolving market conditions, uncertainty, and cost pressures. In our upcoming articles, we will disaggregate our sample of grain farms and examine how this ratio differs by region and farm size.
Acknowledgment
The authors would like to acknowledge that data used in this study comes from the Illinois Farm Business Farm Management (FBFM) Association. Without Illinois FBFM, information as comprehensive and accurate as this would not be available for educational purposes. FBFM, which consists of 5,000+ farmers and 70 professional field staff, is a not-for-profit organization available to all farm operators in Illinois. FBFM field staff provide on-farm counsel along with recordkeeping, farm financial management, business entity planning and income tax management. For more information, please contact our office located on the campus of the University of Illinois in the Department of Agricultural and Consumer Economics at 217-333-8346 or visit the FBFM website at www.fbfm.org.
Note
[1] The Farm Financial Scorecard adheres to the guidelines set by the Farm Financial Standards Council.
References
Mashange, G., D. Raab and B. Zwilling. "The Liquidity of Illinois Grain Farms: Working Capital." farmdoc daily (14):208, Department of Agricultural and Consumer Economics, University of Illinois at Urbana-Champaign, November 14, 2024.
Mashange, G. and B. Zwilling. "Working Capital Trends for Illinois Farms: A Regional Comparison from 2003-2022." farmdoc daily (13):219, Department of Agricultural and Consumer Economics, University of Illinois at Urbana-Champaign, December 4, 2023.
Raab, D. "Assessing Your Working Capital." farmdoc daily (14):198, Department of Agricultural and Consumer Economics, University of Illinois at Urbana-Champaign, October 31, 2024.
Disclaimer: We request all readers, electronic media and others follow our citation guidelines when re-posting articles from farmdoc daily. Guidelines are available here. The farmdoc daily website falls under University of Illinois copyright and intellectual property rights. For a detailed statement, please see the University of Illinois Copyright Information and Policies here.