


Are US Commodity Program Payments Impacting Planted Acres?
The empirical findings in this article raise a question about whether a foundation principle of US commodity policy holds; specifically, that payments made on historical base acres are sufficiently decoupled from planting decisions. We find that, since the 2014 Farm Bill, PLC payment has, with 99% statistical confidence, been related to the change in acres of the large acreage program crops for which USDA (US Department of Agriculture) computes a cost of production. Empirical evidence is strongest for peanuts and rice. Conclusions are not drawn other than that the question raised by this empirical analysis is important.
Background: Summary of Prior farmdoc daily Articles
This set of analyses began with an observation: change in planted acres is the ultimate measure of a crop’s profitability. Farmers increase a crop’s acres only if it is a profitable use of the land. Economic principles imply that a key explanatory variable of change in planted acres should be private market return to production. This relationship between change in acres and private market return was examined in the February 6, 2025 farmdoc daily over the period associated with the current set of US crop commodity programs. Average private market return from 2014 to 2022 was found to explain only 44% of the percent change from 2012-13 to 2023-24 in the acres of USDA cost of production crops: barley, corn, cotton, oats, peanuts, rice, sorghum, soybeans, and wheat.
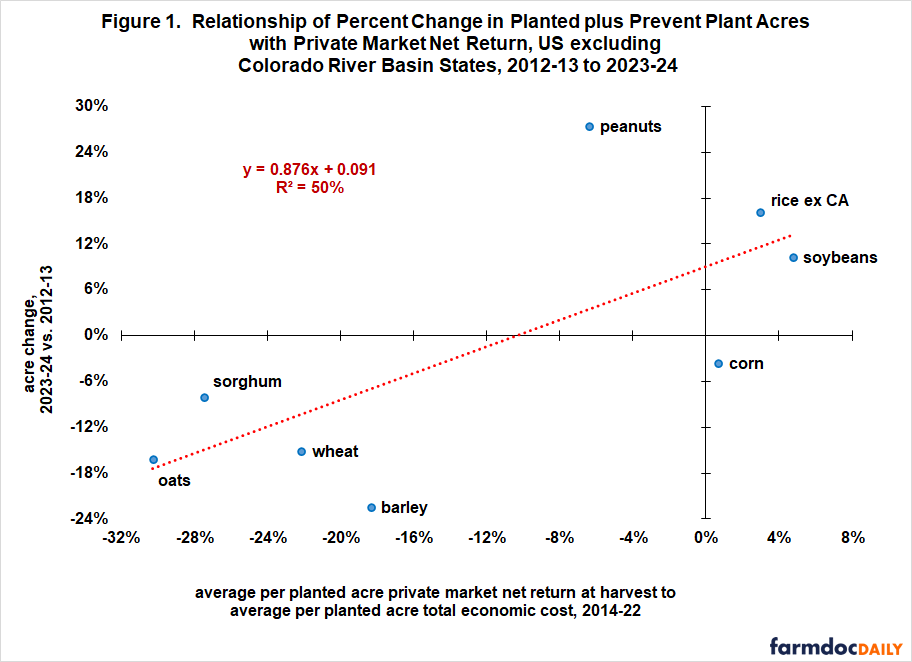
The February 14, 2025 farmdoc daily then examined the impact on US acres of the on-going drought in the states in the Colorado River Basis (Arizona, California, Colorado, Nevada, New Mexico, Utah, and Wyoming). Acres have declined much more in these states than in the rest of the US. The most likely reason is the on-going drought’s impact on the price and availability of water. Removing the acres in these states from US acres, and by implication removing the impact of the drought, improved the power of private market return to explain percent change in acres, but only to 50%. The implication is that variables other than private market return and drought in the states in the Colorado River Basin are needed to more fully explain changes in US acres from 2012-13 to 2023-24.
In this article we examine if government commodity program payments can help explain the change in acres. Since commodity programs are the focus, upland cotton is not included in this analysis. It was not a program crop during the 2014 to 2017 crop years (see Data Note 1). Removing cotton has little impact on the estimated regression equation. For example, explanatory power is the same for the regression in Figure 1, which uses the data used in this farmdoc daily, and for the regression in the February 14, 2025 farmdoc daily, which included upland cotton.
Because rice is reported differently in the two primary data sources used in this article, its designation will change by figure. USDA, NASS (National Agricultural Statistics Service) reports data for long-grain, medium-grain, and short-grain rice. Current commodity programs separate rice into long-grain, Temperate Japonica, and medium-short grain excluding Temperate Japonica. USDA, FSA (Farm Service Agency) reports data using the latter categories. California, which is not included in this analysis since it is one of the states in the Colorado River Basin, almost exclusively grows Japonica rice. Rest of the US primarily grows long-grain rice (93% of planted acres). Considerable overlap exists between California rice and Temperate Japonica rice. Given this situation, it was decided to use “rice ex CA” (California) in figures involving acres, net return, and cost of production, “rice ex Japonica” in figures using FSA program data, and “rice ex CA” in figures using data from both sources.
Background: Commodity Payments since the 2014 Farm Bill
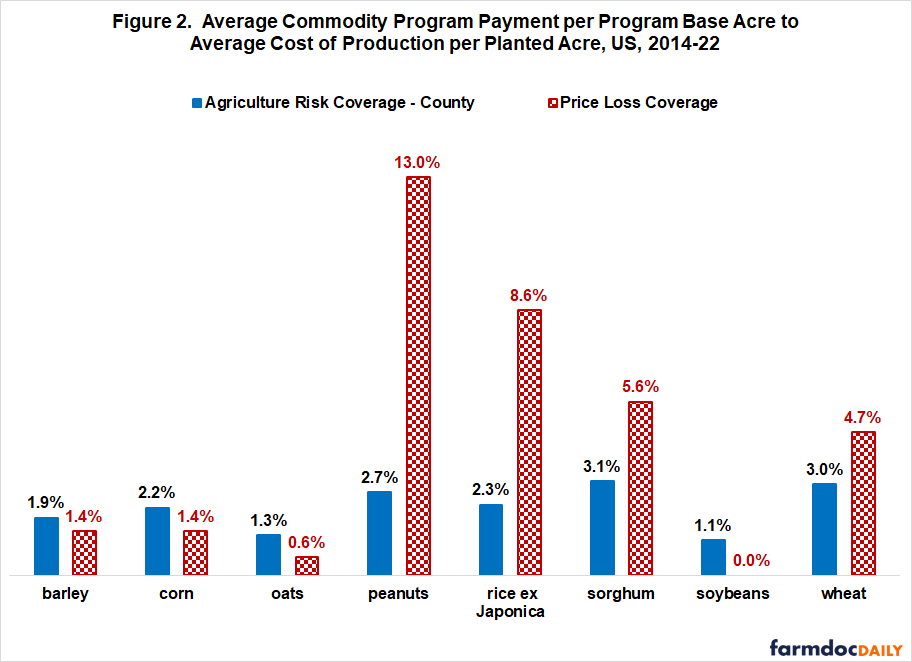
Commodity programs between 2013 and 2024 were first authorized in the 2014 Farm Bill. The main programs have been ARC-CO (Agriculture Risk Coverage – county version) and PLC (Price Loss Coverage). Figure 2 presents the ratio of a crop’s average ARC-CO payment per ARC-CO base acre to the crop’s average total economic cost per planted acre. The same ratio using PLC payment is also presented. The ratio is computed over the 2014 to 2022 crop years, the intervening years between 2012-13 and 2023-24. Per acre payment-to-cost ratio varies much more for PLC. The range for PLC is 13 percentage points (13.0% for peanuts minus 0.0% for soybeans). The range for ARC-CO is 2 percentage points (3.1% for sorghum minus 1.1% for soybeans).
Additional Regression Analysis: Explanatory Power of Commodity Program Payments
The three crops with the highest PLC ratio in Figure 2 (peanuts, rice ex Japonica, and sorghum) are all above Figure 1’s regression line. Acres thus increased more for peanuts and rice ex Japonica and decreased less for sorghum than the crop’s private market return suggests. ARC-CO payment-to-cost ratio is highest for sorghum, with peanuts having the third highest. These observations suggest that commodity program payment, especially PLC, may be statistically associated with the percent change in acres from 2012-13 to 2023-24.
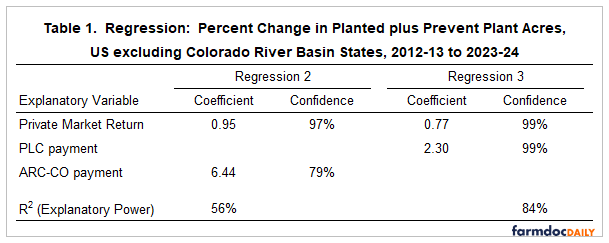
Adding ARC-CO payment to private market return as an explanatory variable increases explanatory power from 50% in Figure 1 to 57% (see regression 2, Table 1). Statistical confidence that this increase is significant is well below 75% based on an F-test (see Data Note 2). In contrast, adding PLC payment to private market return increases explanatory power to 83% (see regression 3, Table 1). The increase is significant with 95% statistical confidence based on an F-test (see Data Note 2). Both private market return and PLC payment have a positive coefficient that is significant with 99% statistical confidence. Thus, higher private market return and higher PLC payment are both associated with more planted plus prevent plant acres of a crop in 2023-24 than in 2012-13. Data Note 3 contains two other regressions estimated to provide additional context to the regression results in Table 1.
Policy Discussion
The finding that ARC-CO payment has no statistically significant association with the change in acres from 2012-13 to 2023-24 aligns with the conventional policy argument. Specifically, paying on less than 100% of production on historical base acres of a crop, as ARC-CO and PLC do, impact planted acres less than paying on current acres planted to the crop. Paying on historical base acres means farmers receive a crop’s commodity payment no matter what crop they plant on the base acre in the current year. Farmers will thus rationally choose to plant the crop that has the highest private market return, the same decision they would make if there was no commodity payment.
In contrast to ARC-CO, PLC payment is associated with the change in acres from 2012-13 to 2023-24 with 99% statistical confidence. This finding could be a statistical anomaly, especially given the small data set. However, statistical significance of PLC payment is high. Moreover, even after removing peanuts, a clear outlier observation, PLC is close to significant at 89% statistical confidence (see Data Note 3). Caution is thus in order in regard to immediately dismissing the empirical findings.
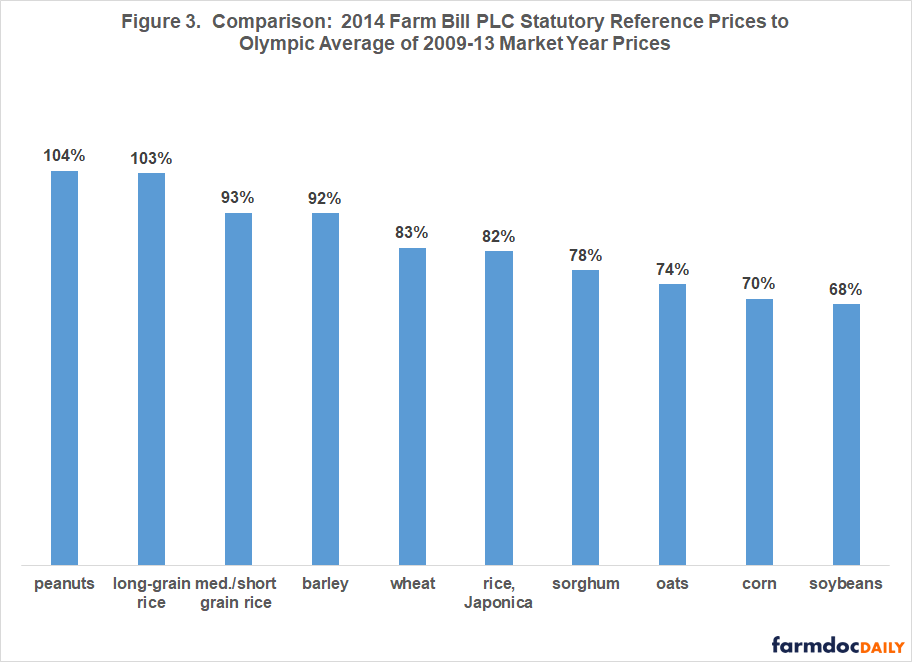
Reinforcing this caution are three other considerations. First, when the 2014 Farm Bill was enacted, it was clear that peanuts and long-grain rice could receive higher, on-going PLC payments than other program crops. PLC statutory reference price for peanuts and long-grain rice was 4% and 3%, respectively, above the Olympic average market year price for 2009 to 2013 (high and low price removed) (see Figure 3). Next highest was medium/short grain rice with a reference price 7% below its Olympic average. Barley was the only other crop with a statutory reference price that was within 17% of its Olympic average market price. Peanuts and long-grain rice ended up receiving a PLC payment in eight of the nine years from 2014 through 2022 (USDA, FSA). Medium/short grain rice received a payment in seven years. Next highest was wheat with six years.
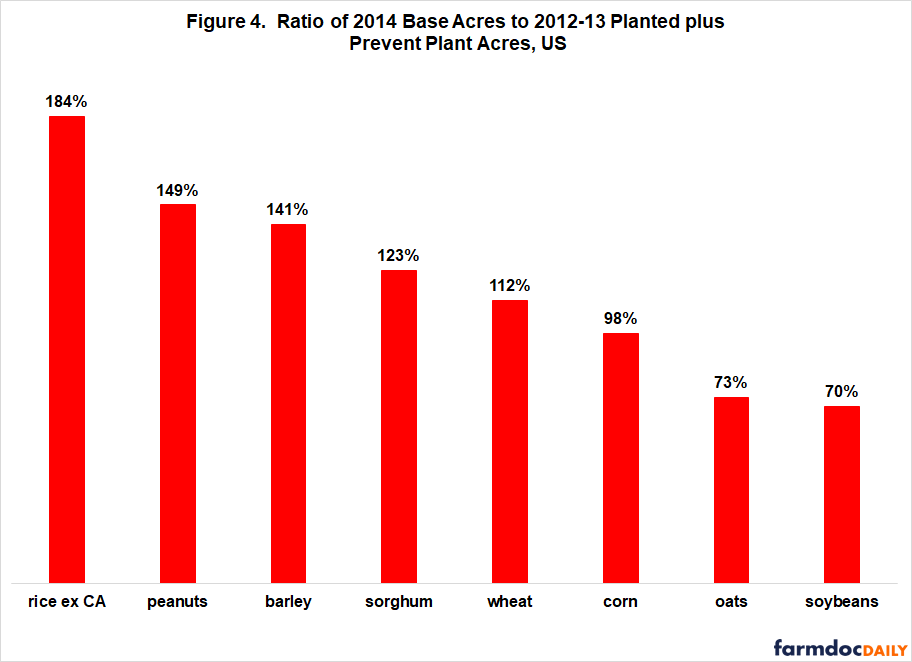
Second, base acres enrolled in the 2014 Farm Bill commodity programs exceeded 2012-13 planted plus prevent plant acres by 49% for peanuts and by 84% for rice ex CA (see Figure 4). Thus, much of the expansion in acres for these two crops from 2012-13 to 2023-24 could have occurred on the crop’s base acres not planted to the crop in 2012-13.
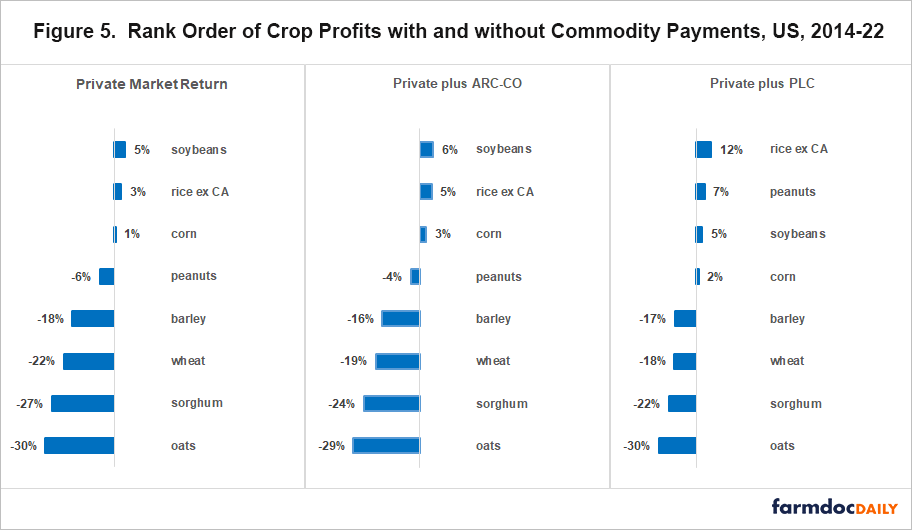
Third, farmers may consider the return to planting a crop on a base acre of the crop to be the private market return to the crop plus the commodity program payment to the crop, particularly when a commodity program payment is expected on a regular basis. From this perspective, the average PLC payment per base acre of 13% for peanuts (see Figure 2) turns a -6% private market loss per planted acre of peanuts into a +7% return. Peanuts becomes the second, not fourth, most profitable crop (see first and third panel in Figure 5). The same adjustment moved rice ex CA from second to most profitable crop, quadrupling its return. Note, ARC-CO payment did not alter the rank order of crop profitability, although rice ex CA has nearly the same combined return as soybeans (see second panel, Figure 5).
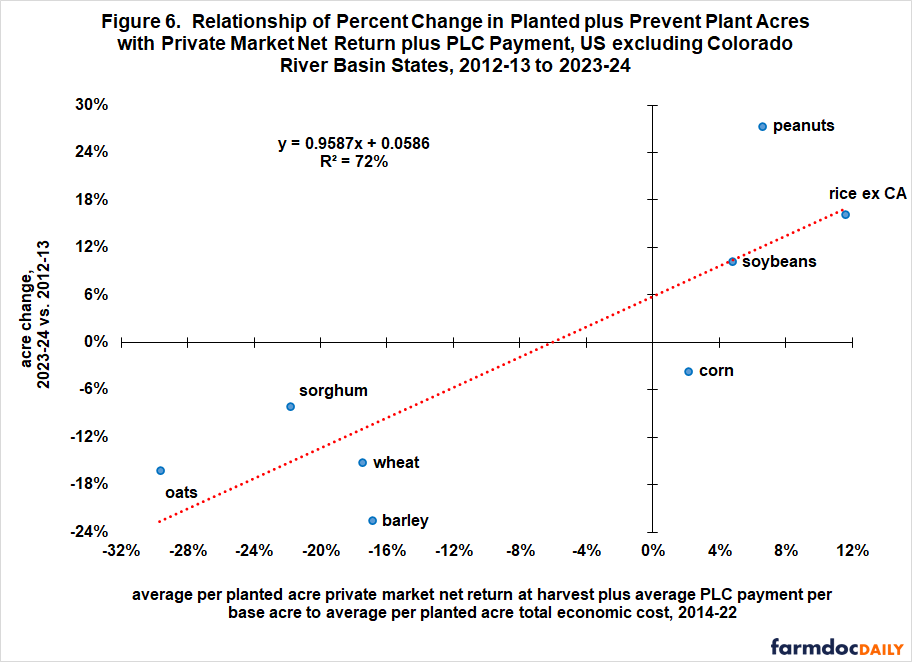
The change in rank order of crop profitability is of interest because the objective of this analysis is to explain the observed change in acres since 2013. Peanuts and rice ex CA are two of the three crops covered in this analysis that had more acres in 2023-24 than in 2012-13 as shown in Figure 1. The third crop, soybeans, had the highest private market return.
A regression relationship is therefore estimated between percent change in acres and the sum of private market return plus PLC payment in Figure 5. Coefficient of the summed return is significant with 99% statistical confidence (see Figure 6). Explanatory power is 72%, which is higher than the 50% explanatory power of private market return by itself (see Figure 1) but lower than, although closer to, the 84% explanatory power of private market return and PLC payment as separate variables (see regression 3, Table 1).
Policy Implications
Change in acres of a crop is the ultimate indicator of a crop’s profitability. Economic principles imply that change in acres should be related to change in private market return to producing the crop. While statistically significant, private market return explains only about half of the percent change in acres of large acreage field crops since authorization of the current crop commodity programs.
Over this period, change in acres and PLC payment per base acre are correlated with statistical significance. This finding raises the question of whether planting decision and PLC payment are coupled.
We are raising a question, not drawing a conclusion.
Significance of PLC payment could be a statistical anomaly, especially given the small number of observations in this analysis. PLC payment could also be a proxy variable related to other variables not accounted for in the analysis (see Data Note 4).
However, PLC payment is significant with 99% statistical confidence. Caution is thus in order in regard to immediately dismissing the empirical findings.
Coupling is an important issue. Coupling means farmer decisions can materially increase program cost over time as they increasingly plant higher paying crops. This is not a desired situation, especially when the Federal budget deficit is a deep concern, as it currently is. Coupling also means commodity payments have crop specific effects, which may impact reporting to the World Trade Organization.
In short, additional analysis and evaluation is needed on whether PLC payment is coupled with planting decisions.
Should additional analysis confirm coupling, policy options to decouple PLC payment from acreage decisions include the following:
- Eliminate PLC, leaving ARC-CO as the only commodity program. This analysis finds ARC-CO payment is not statistically associated with change in acres. This finding is consistent with the market oriented setting of ARC-CO program parameters, which conceptually should minimize coupling.
- Introduce gradual, downside flexibility into the PLC program by crop. For example, for a crop that receives a PLC payment:
- reduce by a given percent the crop’s reference price for the next year, and/or
- reduce by a given percent the crop’s share of base acres on which a payment can be received the next year.
- Cap PLC payment per base acre at no more than a given percent of US per acre cost of production to reduce the likelihood that PLC payments can impact planting decisions.
Data Note 1: Cotton
Cotton was excluded as a covered commodity in the 2014 Farm Bill largely as a response to a successful World Trade Organization suit by Brazil against US cotton support programs. Congress made seed cotton a program crop beginning with the 2018 crop year.
Data Note 2: F-Ratios
F-ratio for the increase in explanatory power of ARC-CO in regression 2 is 0.80. The F-ratio test level for 75% statistical confidence is 1.69. F-ratio for the increase in explanatory power of PLC in regression 3 is 10.11. The F-ratio test level for 95% statistical confidence is 6.61.
Data Note 3: Additional Regressions
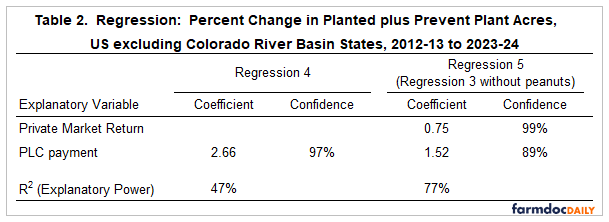
The first regression in Table 2 uses PLC as the only explanatory variable. PLC payment explains 47% of the percent change in acres (see regression 4, Table 2). Its explanatory power nearly equals the 50% explanatory power of private market return as the only variable (see Figure 1). The second regression removes peanuts from regression 3 in Table 1. The reason is to assess the impact of peanuts on the regression results. Peanuts is the furthest from the regression line in Figure 1. Private market return remains a significant explanatory variable (see Regression 5, Table 2). Statistical confidence for PLC declines, but at 89% is just below the lowest commonly-used test level of 90%. Explanatory power without peanuts is lower than the 83% for regression 3 in Table 1, but it is still 78%.
Data Note 4: Generic Base Acres
A potential unaccounted variable could be the generic base program contained in the 2014 Farm Bill. Since cotton was not made eligible for commodity program payments, Congress converted upland cotton base acres into generic base acres. Generic base acres were made eligible for ARC-CO or PLC payments (farmer choice) for a program crop planted on generic base. Generic base ended with the 2017 crop year as Congress made seed cotton a program crop for the 2018 crop year.
Because a generic base payment was made on planted acres, it has been found to be associated with an increase in acres planted to program crops, especially peanuts, during the 2014 to 2017 crop years (for example, see April 13, 2017 and May 18, 2017 farmdoc daily). Since the generic base program ended with the 2017 crop year and since PLC (and ARC-CO) payment is made to base acres, impact of the generic base program on planted acres should have faded post 2017 and may have completely disappeared by 2023. Nevertheless, a possible connection should be kept in mind.
References and Data Sources
Coppess, J., G. Schnitkey, N. Paulson and C. Zulauf. “Beneath the Label: A Look at Generic Base Acres.” farmdoc daily (7):68, Department of Agricultural and Consumer Economics, University of Illinois at Urbana-Champaign, April 13, 2017.
US Department of Agriculture, Economic Research Service. January 2025. Cost of Production. https://www.ers.usda.gov/data-products/commodity-costs-and-returns/
US Department of Agriculture, Farm Service Agency. January 2025. ARC-PLC Program Data https://www.fsa.usda.gov/resources/programs/arc-plc/program-data
US Department of Agriculture, National Agricultural Statistics Service. January 2025. QuickStats. http://quickstats.nass.U.S.da.gov/
Zulauf, C., J. Coppess, N. Paulson and G. Schnitkey. “Planted Acres and Private Market Profitability over the Current Crop Safety Net Period.” farmdoc daily (15):23, Department of Agricultural and Consumer Economics, University of Illinois at Urbana-Champaign, February 6, 2025.
Zulauf, C., J. Coppess, G. Schnitkey and N. Paulson. “Impact of Drought in the States in the Colorado River Basin on US Planted Acres.” farmdoc daily (15):29, Department of Agricultural and Consumer Economics, University of Illinois at Urbana-Champaign, February 14, 2025.
Zulauf, C., G. Schnitkey, N. Paulson and J. Coppess. “Generic Base’s Impact on Planted U.S. Acres: A Multi-Commodity Perspective.” farmdoc daily (7):92, Department of Agricultural and Consumer Economics, University of Illinois at Urbana-Champaign, May 18, 2017.
Disclaimer: We request all readers, electronic media and others follow our citation guidelines when re-posting articles from farmdoc daily. Guidelines are available here. The farmdoc daily website falls under University of Illinois copyright and intellectual property rights. For a detailed statement, please see the University of Illinois Copyright Information and Policies here.