


Should SCO Impact Your Decision to Use ARC-CO for 2025?
The purchase of the Supplemental Coverage Option (SCO) – a county-level crop insurance program providing protection from 86% down to a producer’s COMBO product coverage level – requires use of Price Loss Coverage (PLC) as the commodity title choice. A question we’ve received from multiple farmers is whether the SCO restriction should cause a choice of PLC over Agricultural Risk Coverage at the county level (ARC-CO). For 2025, ARC is likely to trigger more often and make higher payments than PLC for corn and soybeans (see farmdoc daily from January 28, 2025). This article focuses on comparing revenue coverage from ARC-CO and SCO to clarify this decision.
Given that most farmers use revenue protection (RP) at relatively high coverage levels (80% or 85%), the SCO restriction should not complicate the ARC vs PLC decision for most farmers. Still, for some situations SCO could be a valuable enough addition to producers’ risk management plans to push them towards PLC so they remain eligible for its use.
Comparing ARC-CO and SCO
ARC-CO and SCO both offer a band of county-based revenue coverage with support payments being triggered if revenues fall below 86% of the programs’ respective guarantees. However, how guarantees and actual revenues are measured differs under the two programs.
Yields
Both programs measure expected county yields based on historical yields in a county that are adjusted for trend. ARC-CO defines its yield guarantee, referred to as the benchmark yield, using the Olympic average of 5 recent yields, adjusted for trend, for the county. The 5 year period is over the crop years between 2 and 7 years preceding the current year. For 2025, yields from 2019 to 2023 are used with the average based on the 3 “middle” yields over that timeframe (the highest and lowest yields are dropped). The SCO insurance program’s yield component is also based on an expected yield for the county, adjusted for trend, but computed in a different way by the USDA’s Risk Management Agency (RMA). While the expected county yields would be expected to be fairly similar for ARC-CO and SCO, they will not be exactly the same in most counties. In what seem to be limited cases, the benchmark/guarantee and actual yields used for ARC-CO and SCO can have some larger differences.
Prices
The prices and procedures used to set the revenue guarantees’ price component, and the prices used to determine payments, differ even more than yields across the ARC-CO and SCO programs.
ARC-CO uses the national marketing year average (MYA) price measure, which is the same for all counties for a given crop. The benchmark price calculation outlined in the 2018 farm bill is defined as the Olympic average of the 5 most recent completed national marketing year average prices, where any individual year’s price in the history cannot be lower than the PLC program’s effective reference price for the current year. For 2025, the 5 year history includes prices from 2019 to 2023, the same window used for yields. The price used to calculate actual revenue for ARC-CO is the final MYA price for that year. Importantly MYA prices are cash prices, typically lower than futures prices.
SCO uses futures prices for the price component of coverage. For corn and soybeans ,the projected price used to set SCO guarantees is the average settlement of harvest futures contracts (December for corn, November for soybeans) during the month of February. The harvest prices used to calculate actual revenue are average settlements for the harvest contracts during the month of October. If SCO is used with revenue protection (RP) it also includes a guarantee increase where the revenue guarantee is based on the higher of the projected and harvest prices.
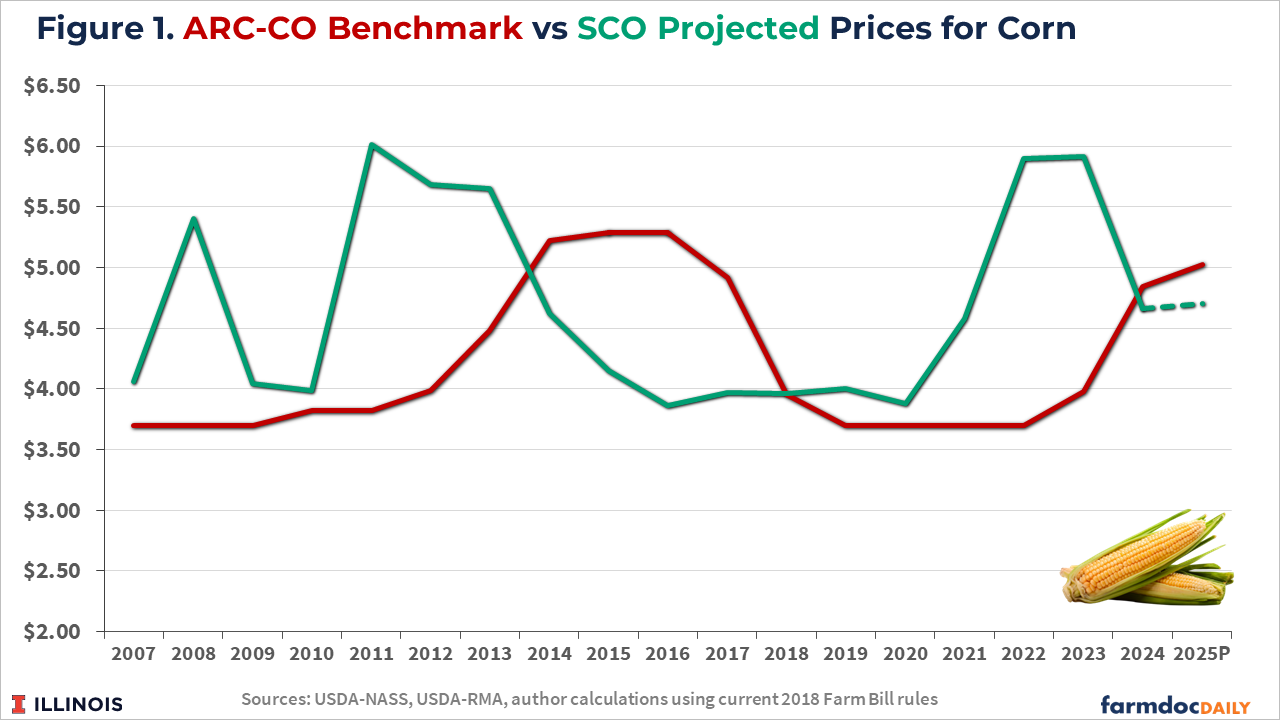
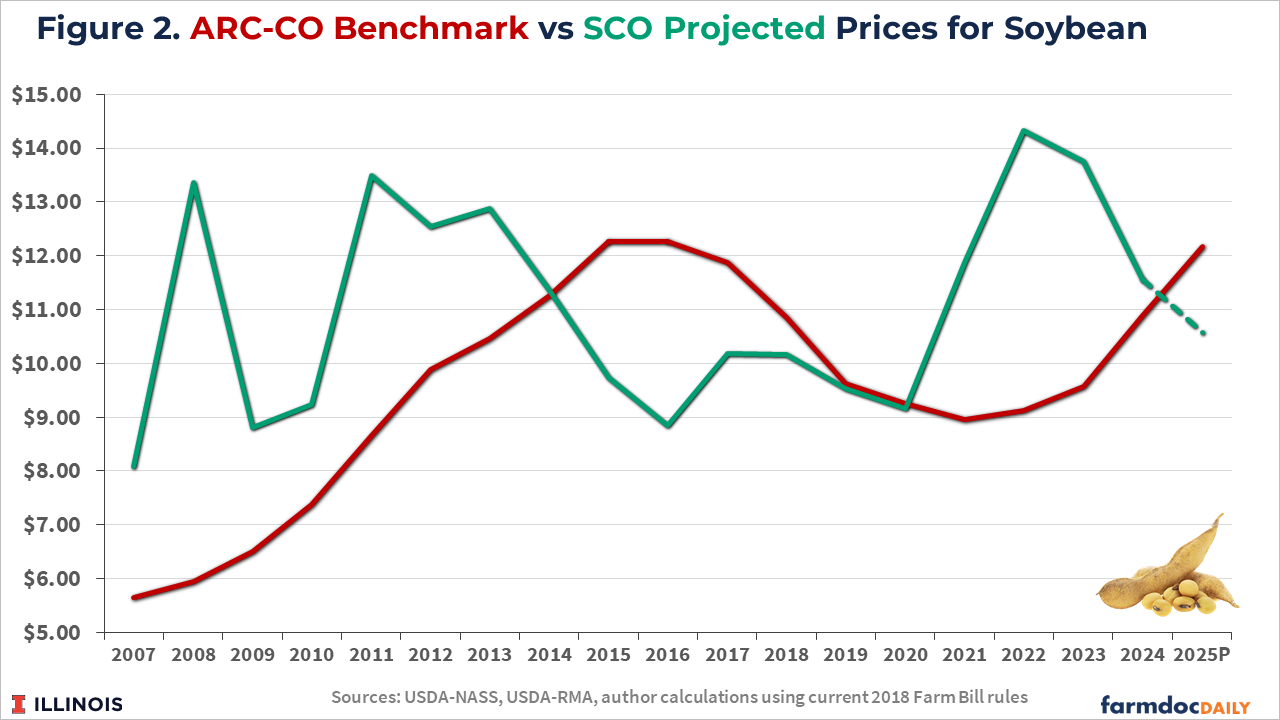
Figures 1 and 2 compare ARC-CO benchmark and SCO projected prices from 2007 through current estimates for 2025 for corn and soybeans, respectively. The historical benchmark and projected prices are calculated using methods currently in place even though ARC-CO was not introduced until 2014 and SCO was not available until 2015. The futures markets used to calculate the SCO projected prices reflected the higher price levels and volatility during the ethanol boom from 2007 to 2013. During this time the ARC-CO benchmark gradually increased but stayed below the futures based projected prices for SCO. The SCO projected prices declined with lower market prices from 2014 to 2020 while the ARC-CO benchmark continued to increase through 2016 before declining due to its use of the rolling 5-year Olympic average. Higher prices from 2021 to 2023 were reflected in the higher SCO projected prices while the ARC-CO benchmarks remained relatively lower. Lower futures prices in 2024, and currently expected for 2025, result in lower SCO projected prices while the ARC-CO benchmarks have risen as the higher prices from 2021-2023 are now used in its rolling average calculation.
Figures 3 and 4 illustrate the historical relationship between actual MYA and ARC-CO benchmark prices (in red) and harvest and projected SCO prices (in green) for corn and soybeans, respectively. Projections are made for ARC-CO for 2024 and 2025. Values greater than zero mean the actual MYA or harvest price was above the benchmark or projected price for that year and vice versa. Since both ARC-CO and SCO have 86% triggers, any ratios greater than -14% mean that county yield losses would be required for payments to be triggered. However, since the majority of farmers in Illinois and throughout the Midwest choose to use RP (see farmdoc daily articles from November 17, 2020, August 27, 2024, and December 17, 2024), their SCO coverage would also include the guarantee increase meaning that positive price deviations always result in increased revenue guarantees with any yield loss of at least 14% triggering an SCO payment.
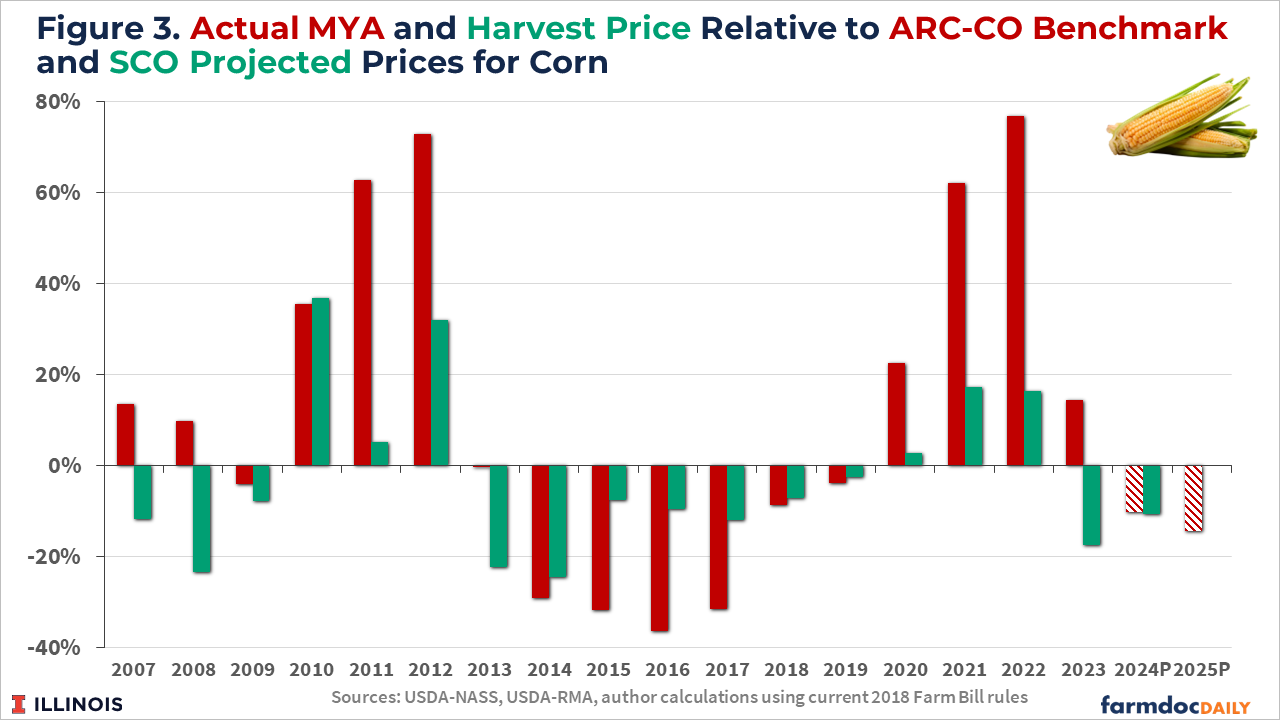
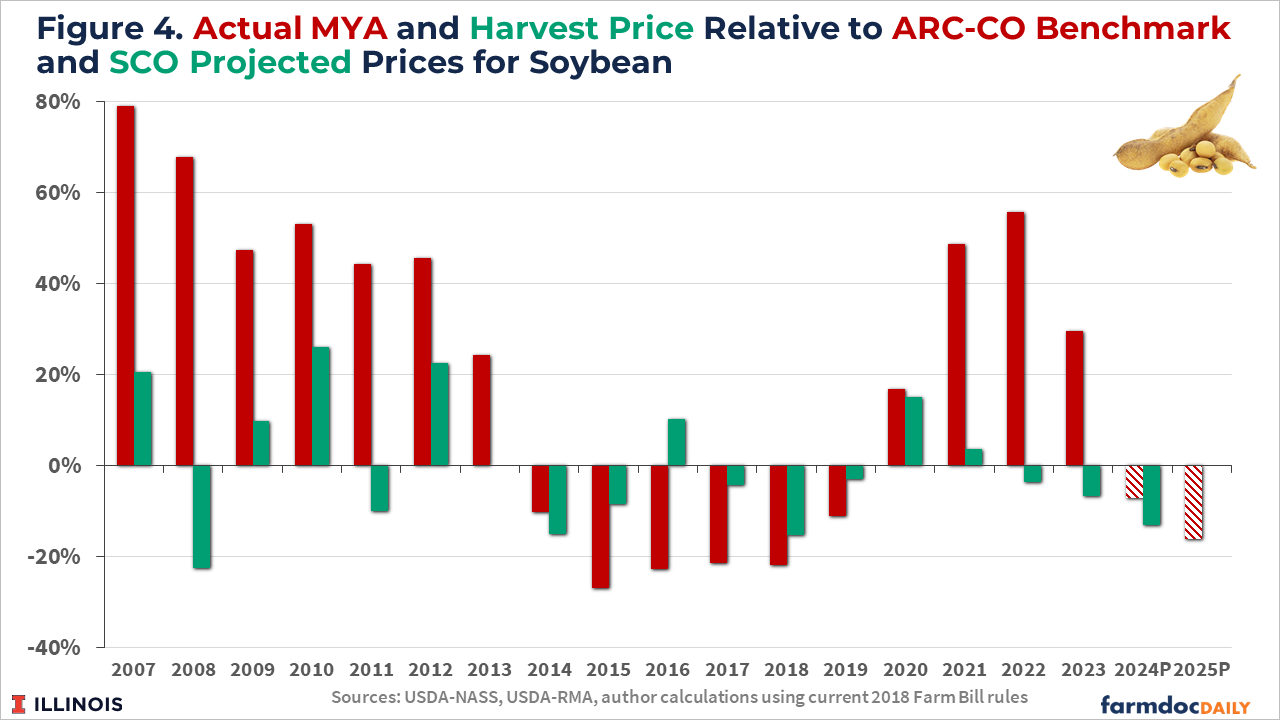
In most years, the relative prices measures for ARC-CO and SCO tend to follow each other with price losses (negative deviations) or price increases (positive deviations) occurring for both programs. Recent notable departures from this were in 2023 when the actual MYA prices for corn and soybeans exceeded the ARC benchmarks (by 14% for corn and 30% for soybeans) while the SCO harvest prices were 17% (corn) and 7% (soybeans) below the projected price. This also occurred in 2022 for soybeans with the MYA price being 56% above benchmark while the SCO harvest price was 4% below the projected price. Differences also occurred in 2007 and 2008 for corn and 2007, 2011, and 2016 for soybeans.
The differences in size of the relative deviations of the actual prices from those used to set guarantees across time is also notable. Negative deviations persisted for both crops from 2014 through 2019, with the price losses being greater for ARC-CO compared with SCO. This means that smaller county yield losses were needed to trigger ARC-CO payments than would have been required for SCO. The 2014 through 2019 period is when some of the largest ARC-CO payments were triggered in various counties over the program’s history.
So what do those price comparisons mean? For 2024 and what is currently expected for 2025, the ARC-CO benchmark price is above the SCO projected price. This means the revenue guarantees in most counties will be larger for ARC-CO than for SCO. Furthermore, the current situation of lower prices after a multi-year period of higher prices could be similar to what was experienced from 2014 to 2019. Both points suggest that ARC-CO could trigger larger payments than what might be expected for SCO.
Summary Points to Consider
Recent price levels and expectations for price levels for the rest of the 2024 and the upcoming 2025 marketing years indicate ARC-CO seems more likely to trigger support payments than PLC in most reasonable price and yield scenarios. Moreover, historical experience suggests that ARC-CO might also be more likely to trigger payments driven by price losses in 2025 than the SCO insurance program.
Some recommendations and factors to consider:
- For producers planning to purchase RP coverage at relatively high levels (80% or 85%), SCO coverage eligibility is not likely to overly complicate the choice between ARC-CO vs PLC. With high RP coverage, SCO’s coverage band is relatively small. ARC-CO will likely trigger larger payments across most scenarios. Moreover, producers can buy add-up coverage using the Enhanced Coverage Option (ECO) if their acres are enrolled in ARC (see farmdoc daily from February 11, 2025). Producers who are concerned with the potential for significantly low price scenarios may still prefer PLC and thus have access to the SCO option.
- For producers purchasing RP or other individual plans at coverage levels at or below 75%, the potential use of SCO coverage may be a more significant factor in making the ARC vs PLC program choice. Using PLC allows the use of SCO, although the farmer premiums for SCO coverage with lower coverage level individual plans become larger and thus may become a limiting cost factor. Again, producers who are concerned with the potential for significantly low price scenarios may still prefer PLC.
- Use of SCO may be of greater interest in a couple of instances. First, since SCO covers planted acres and ARC/PLC cover base acres, SCO may be a more attractive option for producers who are “under-based” – meaning they have fewer base acres than planted acres for the main crops on their farms. This is particularly common for soybeans, as planted acres typically exceed base acres (see farmdoc daily from August 3, 2023). Second is if a major crop loss occurs in 2025, perhaps due to a drought or similar weather event, that pushes prices higher. In this case SCO, if used with RP coverage, will have the valuable Harvest Price Option guarantee which uses the higher price at harvest (note that PLC would not provide support in this scenario).
In summary, prices and price expectations suggest ARC-CO is likely to be associated with larger expected payments for corn and soybeans in the 2025 crop year. Some producers may be in situations where using SCO has enough value to cause them to choose PLC. The widespread use of high RP coverage, as well as the ability to add ECO coverage, tends to support the choice of ARC-CO for corn and soybeans in 2025.
References
Batts, R., N. Paulson and G. Schnitkey. "Introducing the Crop Insurance Summary of Business Tool." farmdoc daily (14):157, Department of Agricultural and Consumer Economics, University of Illinois at Urbana-Champaign, August 27, 2024.
Coppess, J. "Farm Bill 2023: Planted Acres and Additional Pieces of the Base Acres Puzzle." farmdoc daily (13):143, Department of Agricultural and Consumer Economics, University of Illinois at Urbana-Champaign, August 3, 2023.
Paulson, N., G. Schnitkey, R. Batts and C. Zulauf. "The 2025 Farm Bill What-If Tool." farmdoc daily (15):16, Department of Agricultural and Consumer Economics, University of Illinois at Urbana-Champaign, January 28, 2025.
Schnitkey, G., N. Paulson and C. Zulauf. "Enhanced Coverage Option for 2025." farmdoc daily (15):26, Department of Agricultural and Consumer Economics, University of Illinois at Urbana-Champaign, February 11, 2025.
Schnitkey, G., N. Paulson and C. Zulauf. "Update on Historic Use of Crop Insurance Products in Illinois." farmdoc daily (14):228, Department of Agricultural and Consumer Economics, University of Illinois at Urbana-Champaign, December 17, 2024.
Schnitkey, G., N. Paulson, C. Zulauf and K. Swanson. "Revenue Protection: The Most Used Crop Insurance Product." farmdoc daily (10):198, Department of Agricultural and Consumer Economics, University of Illinois at Urbana-Champaign, November 17, 2020.
Disclaimer: We request all readers, electronic media and others follow our citation guidelines when re-posting articles from farmdoc daily. Guidelines are available here. The farmdoc daily website falls under University of Illinois copyright and intellectual property rights. For a detailed statement, please see the University of Illinois Copyright Information and Policies here.