


The Soybean Industry Response to the Renewable Diesel Boom, Part 3: the Value of Soybean Oil in the Soybean Crush
The US soybean industry has responded to the renewable diesel boom by increasing production of soybean oil, an important feedstock in bio-based diesel production. In recent farmdoc daily articles (Janzen and Wang, 2025 and Janzen, Irwin, and Wang, 2025) , we show increased US soybean oil production is part of longer-run gains in soybean processing efficiency. In the past five years, these efficiencies allowed US soybean processors to squeeze more oil from the crush (relative to the production of soybean meal) when demand for renewable diesel surged, especially as the processing industry dealt with short term constraints on soybean crushing expansion.
Market price changes are another part of the response to a major shift in soybean oil demand. However, understanding how observed price changes are related to the renewable diesel boom is complicated by the multi-product nature of soybeans. An earlier farmdoc daily article (Irwin, 2017) found the boom in US biodiesel production of 2011-2017 did not lead to higher soybean oil prices, the main biodiesel feedstock. Gross margins and price dynamics among the components of the crush remained stable during that period.
Irwin (2017) argued China’s soybean import boom, which paralleled the U.S. biodiesel boom, explained the apparent stability of prices in the soybean complex in the 2010s. Since soybean oil is a joint product that is produced in fairly fixed proportions when soybeans are crushed, China’s soybean import boom necessarily also produced a huge quantity of soybean oil. This large increase in global soybean oil supplies, also boosted by good growing season weather, allowed the US boom in biodiesel production to take place without causing a corresponding surge in soybean oil prices. These earlier findings highlight the important role that the soybean crush plays in understanding the relationship between biomass-based diesel markets and soybean prices.
This article reexamines the dynamics of the soybean crush using more recent price data for the renewable diesel boom period from late 2020 to present. We show that price interrelationships in the soybean complex have changed. The soybean oil share of the value of crush output has become larger and more volatile. Similarly, crush margins, the value of oil and meal less the value of soybeans, have been subject to significant swings. Co-movement in price changes for the three components of the crush – soybeans, oil, and meal – has shifted and the correlation between these price changes has broken down. For soybean industry stakeholders considering the possibility of further growth in biomass-based diesel production due to recent EPA rulemakings, soybean complex price swings in the past five years suggest pricing relationships have yet to find a ‘new normal’.
Calculating Crush Shares and Margins
We begin with an example of computing the components of the soybean crush and the crush margin. For this analysis, we maintain fixed weights of 11 pounds of soybean oil and 48 pounds of soybean meal per 60-pound bushel of soybeans as in Irwin (2017). Our focus is on changes over time in crush values, rather than quantities. Since the changes in values and margins over time tend to be larger than changes in quantities, we maintain the fixed weights assumption (see Appendix below for more).
On September 16, 2025, the price of soybeans at Illinois processing plants was $10.23 per bushel, the price of soybean meal was $305.40 per ton, and the price of soybean oil was $0.50 per pound. Following the assumptions above, one bushel of soybeans on September 16 produced the following crush revenue:
Soybean meal: $305.40 per ton / 2000 x 48 = $7.33 per bushel, and
Soybean oil: $0.498 per pound x 11 = $5.48 per bushel.
The share of crush value for each component is the revenue for each component as a percentage of total revenue. For soybean oil, this is $5.48 / (7.33 + 5.48) = 0.428 = 43%.
The crush margin is simply the difference between total revenue from oil and meal outputs and the cost of input, soybeans:
Margin = ($7.33 + $5.48) – $10.23 = $2.58 per bushel.
Note that the crush margin computed in this manner is the gross margin of the soybean processor. All other variable and fixed costs must be subtracted to obtain the net margin.
Soybean Crush Price Dynamics
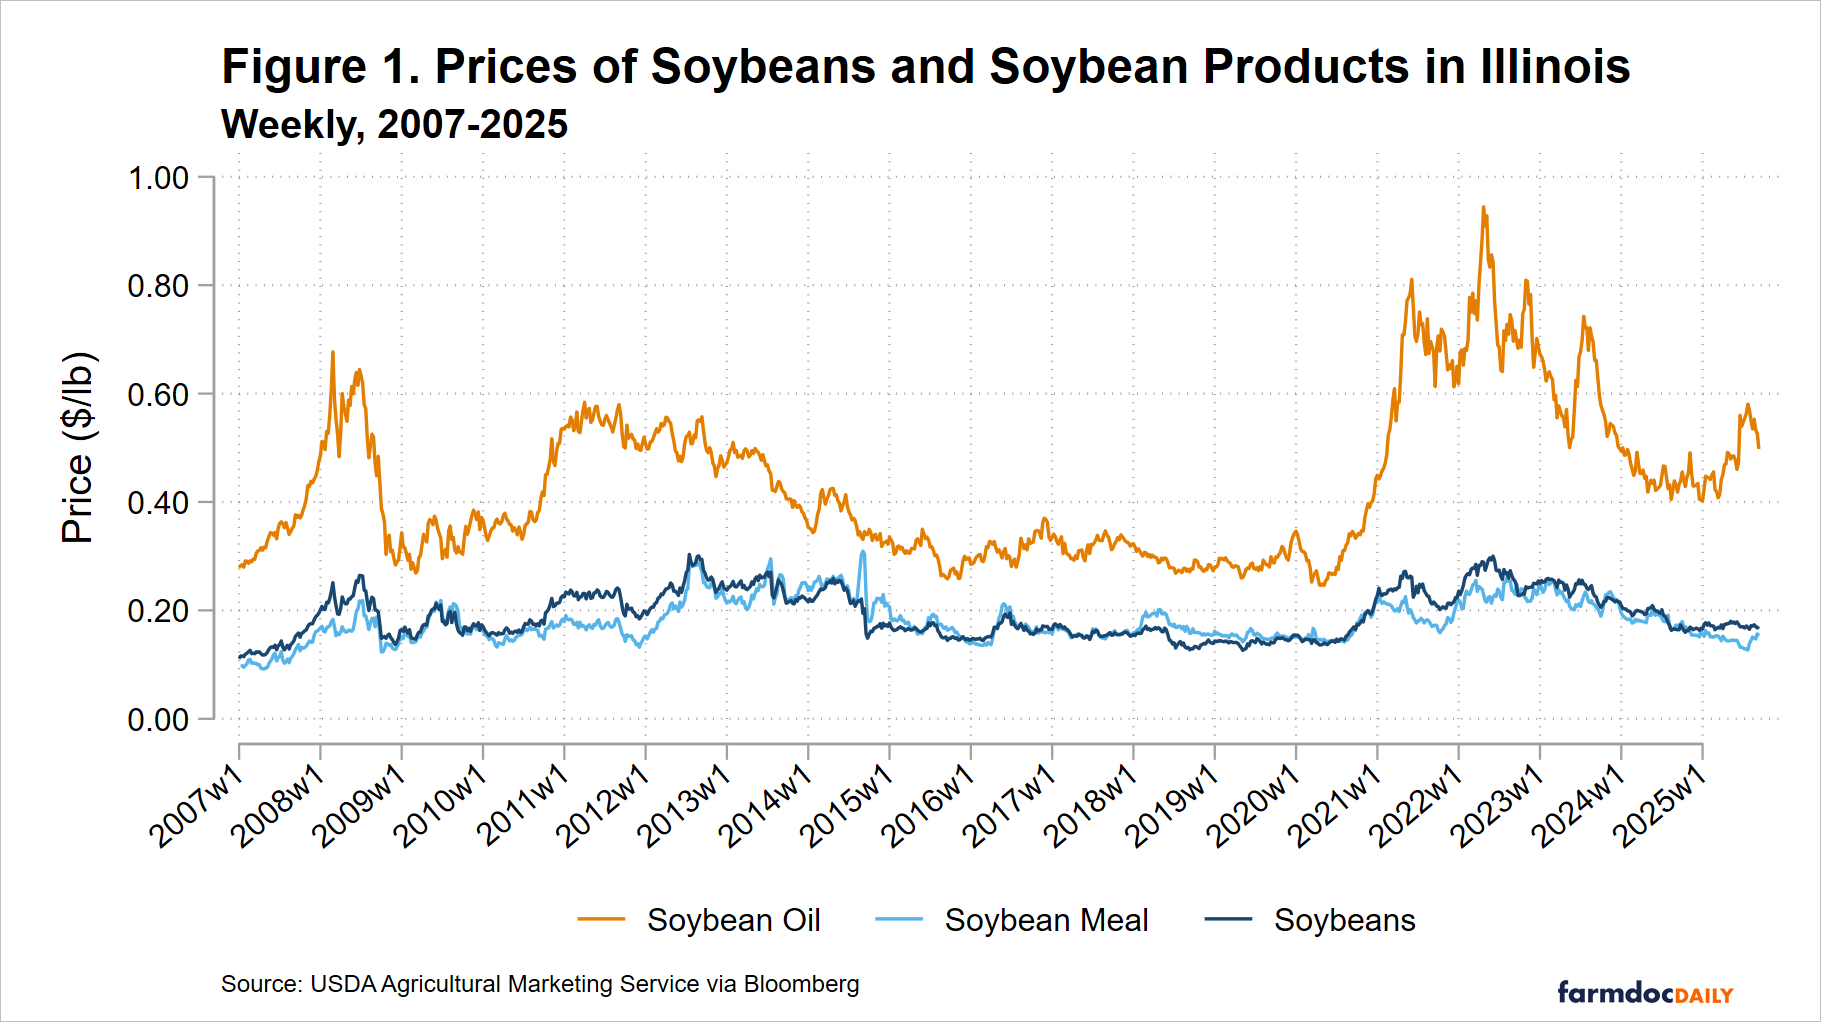
We analyze changes in soybean seed, oil, and meal values over time to describe the market impact of the renewable diesel boom. Figure 1 plots the weekly prices of soybean oil and meal at Illinois processing plants, plus the price of soybeans at Central Illinois elevators from January 2007 to September 2025. We cover this long period to allow for comparisons to the earlier analysis in Irwin (2017). We convert all prices to dollars per pound to present units on a single axis which makes obvious that oil is more valuable than meal by weight. As found previously, both oil and meal prices move in a wide range and tend to move together. After a period of low and stable prices between 2014 to 2020, prices for all components of the soybean crush have been relatively high since 2020. The massive increase in soybean oil prices between late 2020 and early 2022 stands out in Figure 1. The soybean oil price nearly tripled from $0.26 per pound to $0.94 per pound. At the same time, soybean and soybean meal prices increased, but not as much. Soybean prices roughly doubled and soybean meal prices increased by roughly 60%.
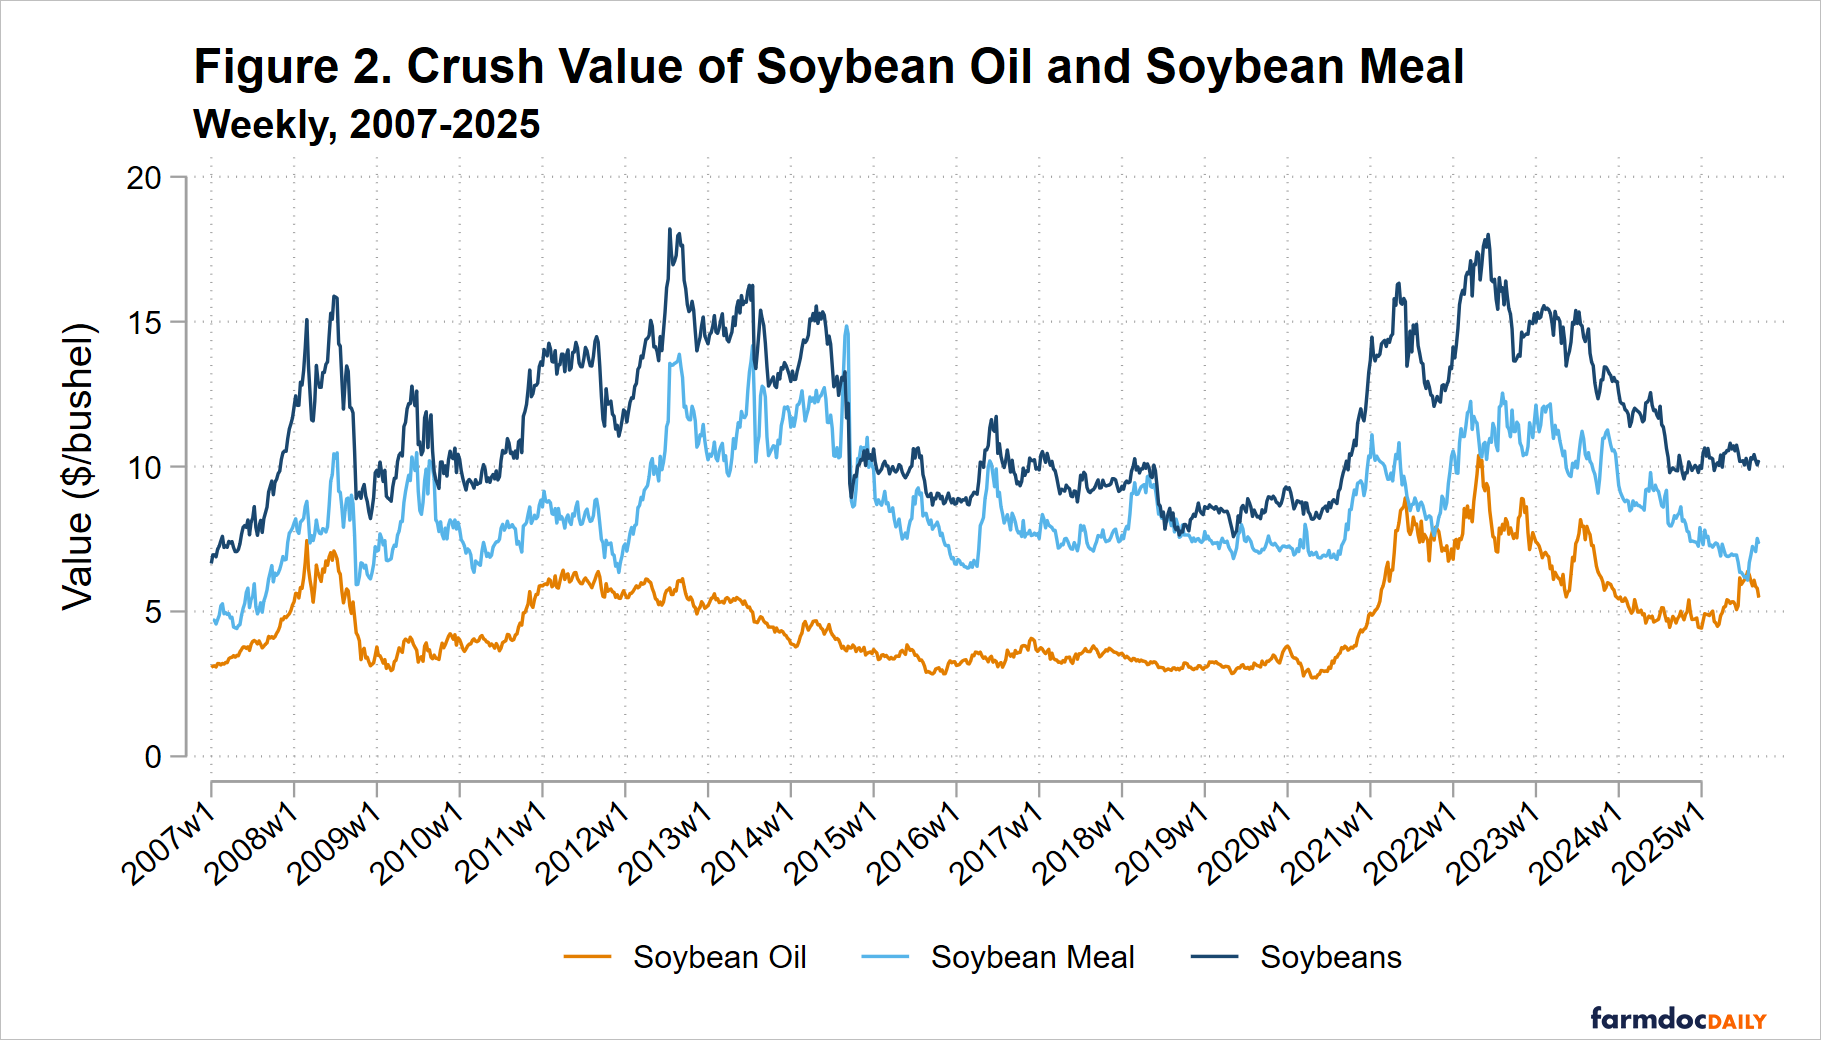
While soybean oil is more highly priced than soybean meal per pound, one bushel of soybeans yields over four times as much meal as oil. Figure 2 accounts for this difference in yield and multiplies the per pound price by the pounds of each co-product produced when crushing a bushel of soybeans (48 pounds soybean meal and 11 pounds soybean oil). Expressed this way, it is clear that soybean meal has generally contributed the majority of the crushing value of soybeans on a per bushel basis. The average per-bushel value of soybean meal between 2007 and 2025 was $8.66 per bushel, compared to $4.72 per bushel for soybean oil. However, this has changed with the sharp run up in soybean oil prices beginning in late 2020. Soybean oil value has reached parity with soybean meal in 2021 and again in mid-2025.
Figure 2 makes clearer the correlation between soybean crush component prices. Soybeans and soybean oil and meal values tend to move together. High prices for one component imply high prices for the others, but there are periods where this correlation breaks down. Irwin (2017) noted one such period in 2012 when soybean oil values remained low while soybean and soybean meal values increased. Another such divergence has come more recently in 2025. Oil values rose in the first half of the year as meal values declined.
Oil’s Share of Crush Value: Bigger and More Volatile
Changes in relative prices over time imply changes in the share of the crush value attributable to oil and meal. Figure 3 provides a sense of the value proportions for oil and meal by presenting the percentage of total crush value represented by soybean oil. Of course, 100 minus this percentage is the value proportion represented by soybean meal. Given the volatility of the prices seen in Figures 1 and 2, it is not surprising that there is a wide range for the percentage oil value, from roughly 25 to 50 percent of the total. Here the impact of the renewable diesel boom is apparent; unlike the biodiesel boom of 2011-2017 considered by Irwin (2017), there is a stark jump in the oil value share in late 2020 that has persisted to the present. Between 2013 and 2020, the oil value share ranged between 25 to 35 percent. Since 2020, it has only rarely been below 35 percent. In both 2021 and 2025, it briefly reached 50 percent. Notably, the 2021 surge in oil’s share of crush value was due to changes in relative prices: oil increased more than meal. In 2025, oil prices rose as meal prices fell.
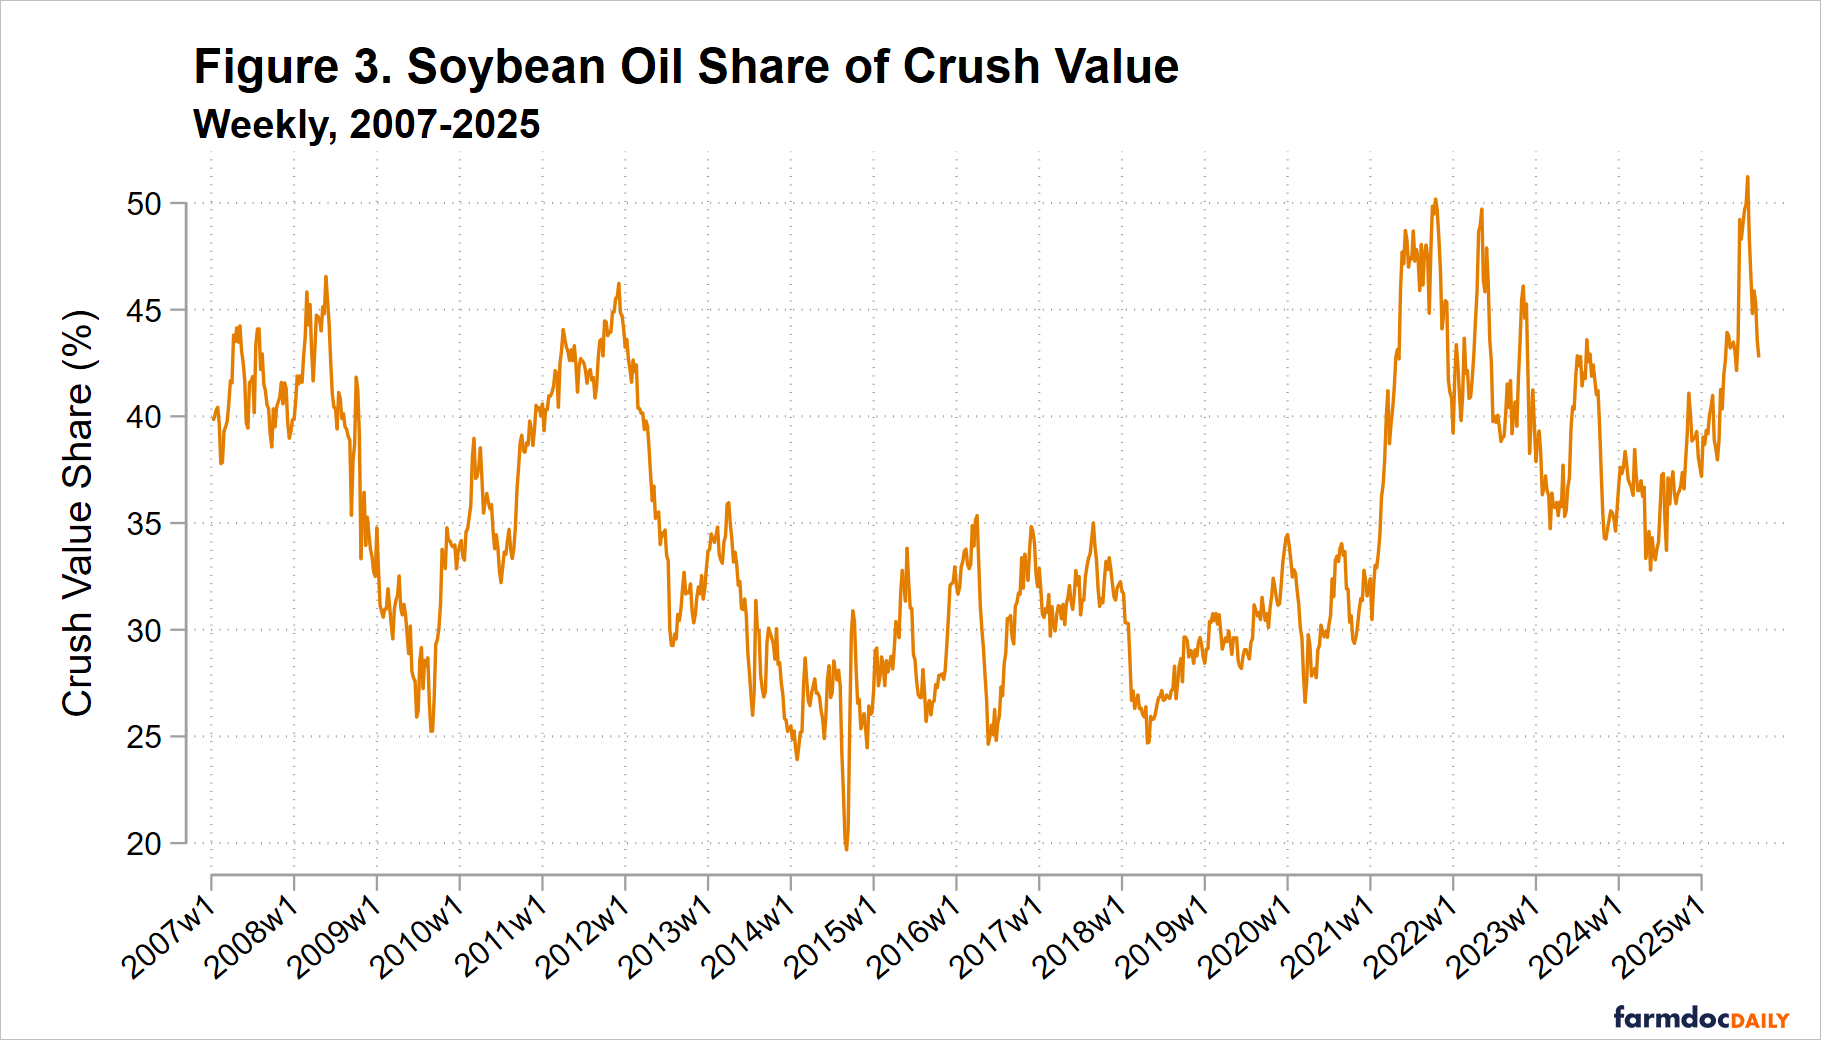
Figure 4 shows the movement over time in the crush margin itself (soybean meal value plus soybean oil value minus soybean price). Again, Irwin (2017) showed crush margins were relatively stable during the earlier biodiesel boom and figure 4 suggests this was generally true between 2015 and 2020. Since late 2020, crush margins have periodically increased and become considerably more volatile. Changes in crush margins are much larger now than they were before 2020.
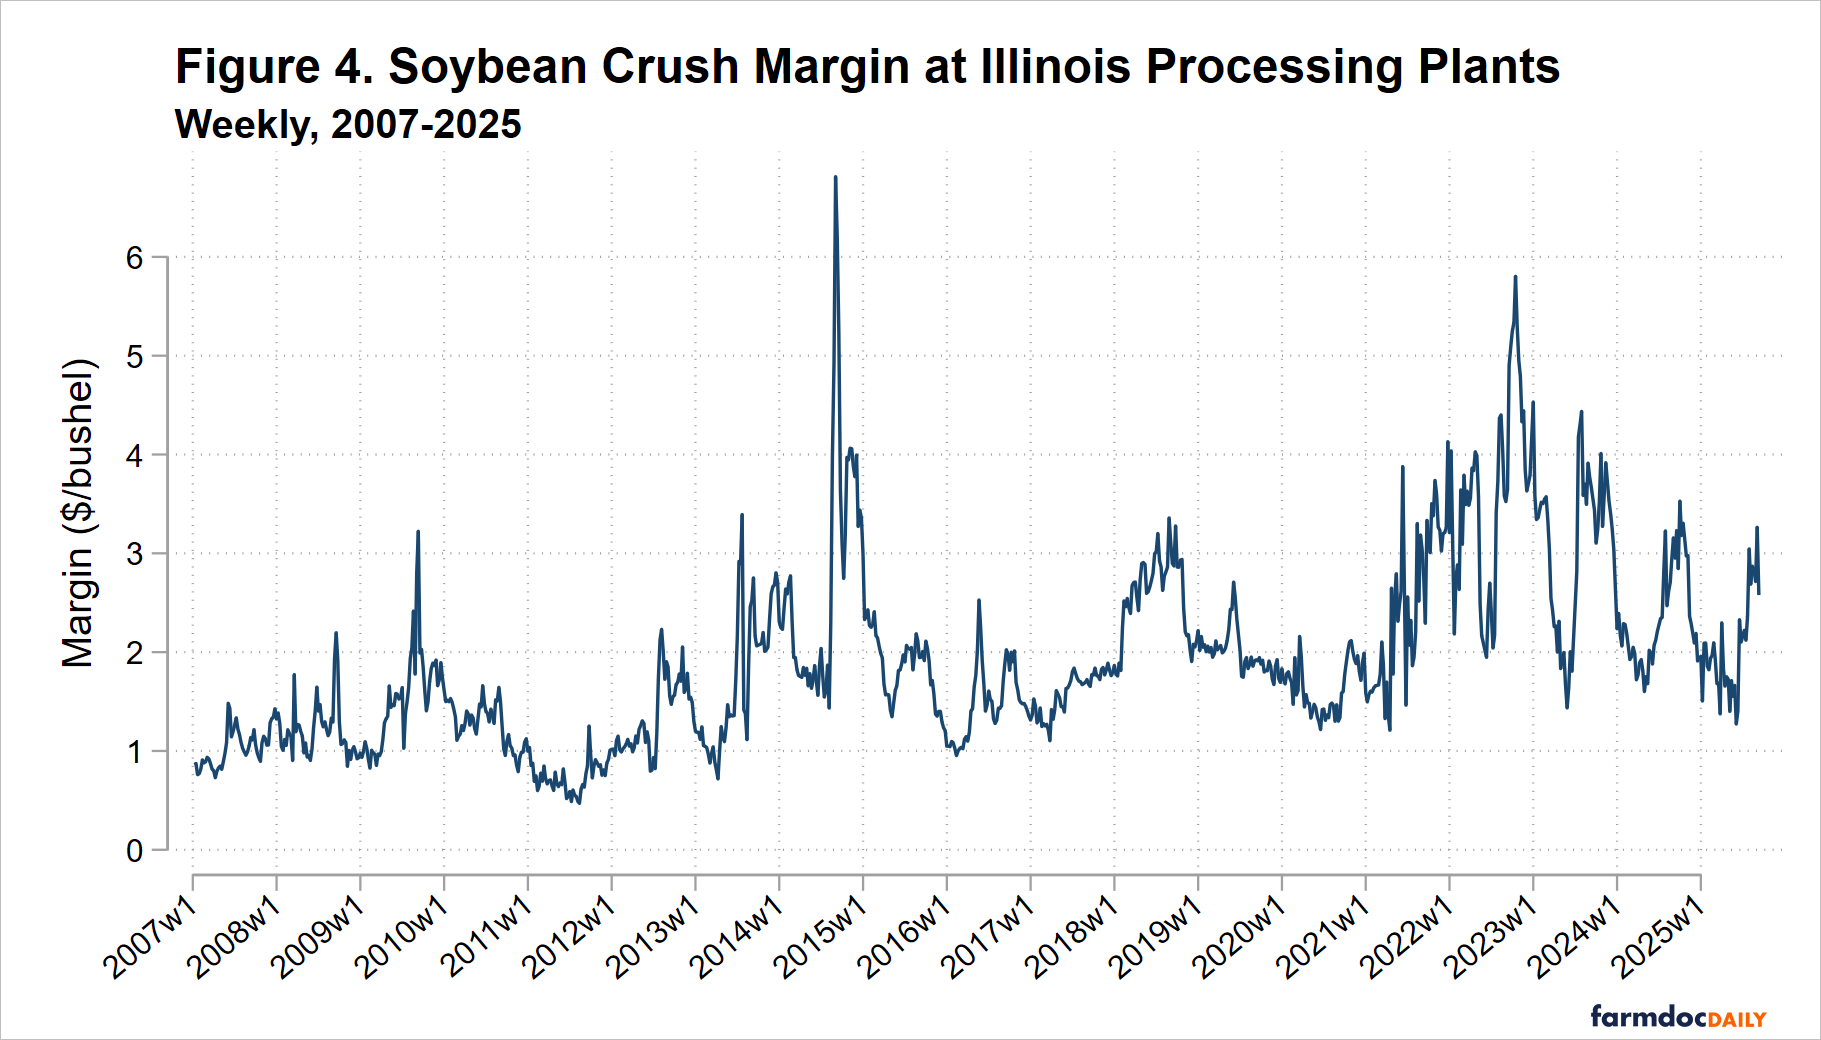
Figures 1 to 4 show substantial changes in absolute and relative prices for soybean and soybean products since late 2020. These shifts suggest the renewable diesel boom has significant market impacts consistent with increased soybean oil demand exerting upward pressure on the price of soybean oil relative to soybean meal. Perhaps more importantly for future price expectations, they imply a new and higher level of volatility in the soybean complex.
Regression Analysis: Relationships Break Down
Irwin (2017) found changes in soybean oil prices during the 2011-2017 biodiesel boom maintained a consistent linear relationship with changes in soybean values. He estimated regression models that expressed the week-to-week change in soybean prices as a function of changes in oil and meal prices. These regressions showed i) a given per-pound change in soybean oil prices had a smaller association with changes in soybean prices and ii) these associations were stable over time. He found relationship did not change before and after December 2011, which he proposed as the start of the biodiesel boom.
We update the Irwin (2017) regression analysis using more recent data to assess whether the association between soybean price changes and oil and meal price changes has shifted during the more recent renewable diesel boom. Specifically, we estimate a simple regression model of soybean pricing and examine whether the coefficients on soybean oil change after the renewable diesel boom. The regression is estimated in first differences (changes) in order to remove the strong level effects in the data. The estimation results for the full sample of May 2007 through September 2020 are as follows,
dSB(t) = 0.000 + 0.511 dSBM(t) + 0.232 dSO(t), R^2 = 0.791,
which is similar to the stable results Irwin (2017) found for various subperiods between 2007 to 2017. All coefficient estimates are statistically different from zero. The R-squared statistic implies observed oil and meal price changes explain nearly 80% of the variation in soybean prices. The results are similar for the 2017 to 2020 period after Irwin concluded his analysis but before the renewable diesel boom period.
When we re-estimate this model for the renewable diesel boom period of October 2020 to September 2025, we get remarkably different results. The estimation results are as follows,
dSB(t) = 0.000 + 0.451 dSBM(t) + 0.070 dSO(t), R^2 = 0.322,
Notably, changes in oil and meal prices explain much less of the variation in soybean prices in this more recent period; the R-squared statistic is now just 32%. It appears a previously stable relationship among soybean crush components has broken down. The result suggests new models are necessary to describe pricing in the soybean complex when there is growing domestic demand for soybeans as a feedstock in US renewable fuels production.
Implications
We update earlier work by Irwin (2017) to show price interrelationships in the soybean complex have changed since the renewable diesel boom. As US soybean demand has shifted away from exports and toward domestic biofuels demand, old relationships among crush component prices are being updated. In this process, the shares of soybean value due to the value of oil and meal are shifting and becoming more variable. Crush margins too are becoming more volatile. Regression analysis suggests this makes soybean price changes harder to predict. Farmers and others trying to anticipate future prices should expect to make larger prediction errors. One component of this unpredictability has likely been the uncertain US policy environment for renewable fuels (Irwin and Gerveni, 2025). Future supply and demand information should be examined not only for its implications for soybean price levels, but also price volatility and correlation with product prices.
Appendix
While this analysis follows Irwin (2017) in using weights of 11 pounds of soybean oil and 48 pounds of soybean meal in each 60 pound bushel of soybeans, we note that the weights assigned to oil and meal in the crush may not perfectly describe realized crush margins. According to the standard ‘board’ crush margin calculation, a bushel of soybeans yields “11 pounds of soybean oil, 44 pounds of 48 percent protein soybean meal, 4 pounds of hulls and 1 pound of waste” (CME Group). Some crush margin calculations combine the meal and hull quantities so that the crush yields 48 pounds of lower protein soybean ‘meal’. While CME soybean meal futures maintain a 48 percent protein standard, available soybean meal price data from USDA-AMS refer to a lower 46.5 percent specification. Data on US crush output from the National Oilseed Processors Association indicate the soybean oil share of crush output has grown from just more than 11 pounds to about 12 pounds per bushel and the soybean meal share of output has been consistently between 47 to 48 pound per bushel. USDA crush data indicate a meal share closer to 44 pounds. So the crush weights may actually be shifting over time. Regardless, changes in value over time are much larger than concurrent changes in quantity, so assigning fixed and approximately correct weights to oil and meal in the crush yields useful results.
References
Gerveni, M. and S. Irwin. "Policy Priorities for Biomass-Based Diesel." farmdoc daily (15):17, Department of Agricultural and Consumer Economics, University of Illinois at Urbana-Champaign, January 29, 2025.
Irwin, S. "The Value of Soybean Oil in the Soybean Crush: Further Evidence on the Impact of the U.S. Biodiesel Boom." farmdoc daily (7):169, Department of Agricultural and Consumer Economics, University of Illinois at Urbana-Champaign, September 14, 2017.
Janzen, J. and Y. Wang. "The Soybean Industry Response to the Renewable Diesel Boom, Part 1: the Long-Run Evolution of Oilseed Crushing." farmdoc daily (15):154, Department of Agricultural and Consumer Economics, University of Illinois at Urbana-Champaign, August 25, 2025.
Janzen, J., S. Irwin and Y. Wang. "The Soybean Industry Response to the Renewable Diesel Boom, Part 2: Squeezing More Oil from the Soybean Crush." farmdoc daily (15):165, Department of Agricultural and Consumer Economics, University of Illinois at Urbana-Champaign, September 10, 2025.
Disclaimer: We request all readers, electronic media and others follow our citation guidelines when re-posting articles from farmdoc daily. Guidelines are available here. The farmdoc daily website falls under University of Illinois copyright and intellectual property rights. For a detailed statement, please see the University of Illinois Copyright Information and Policies here.