


Has US Return to Storing Corn and Soybeans Declined over Time?
No evidence is found that net return to cash storing US corn and soybeans has declined over time. A decline in net return to futures hedged storage cannot be ruled out. The evidence is not definitive. It is common to hear that increasing South American production is reducing US returns to storing corn and soybeans, but it seems unlikely that only hedged storage returns would be impacted. A more likely explanation for the different time trend behaviors is the increase, since the late 1990s, in the share of US field crop storage capacity that is off-farm. Increased competition usually reduces returns, which for first handler storage is commonly believed to predominantly be hedged storage.
Data and Procedures
This article uses the net returns to cash and futures hedged storage of the average US corn and soybean bushel reported in the farmdoc daily of October 8, 2025. It used the cost of storage in the farmdoc daily of October 2, 2025. Cash and futures hedged storage are the two most common storage strategies. Storage periods examined are from October (harvest low) to December through May over the 1974-2024 marketing years. November is not included as it can be a harvest month, especially for corn. The October 8, 2025 farmdoc daily used June as the latest end-of-storage month. This study uses May to reduce crowding in the figures. Excluding June does not alter the overall findings.
Net Cash Storage Returns over Time
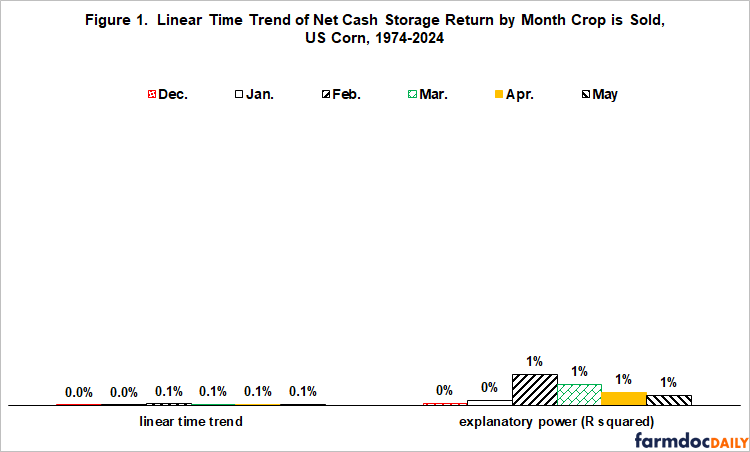
Linear time trend of net return to cash storage is positive for all corn and soybean storage periods (left side of Figures 1 and 2), suggesting returns to cash storage have trended up since 1974. Explanatory power of the time trend is however minimal, especially for corn (roughly 1%). For soybeans, highest explanatory power is 9% for October-February storage, implying the time trend explains 9% of year-to-year variation in soybean net cash storage return. Statistical significance exceeds 90% confidence but not 95% confidence for 3 soybean storage periods: October-December, October-January, and October-February. Both percentages are commonly used to assess statistical significance. For corn, statistical significance never exceeds 62% confidence for any storage period. Collectively, these results imply no downward trend in US corn and soybean net returns to cash storage since 1974.

Net Hedged Storage Returns over Time
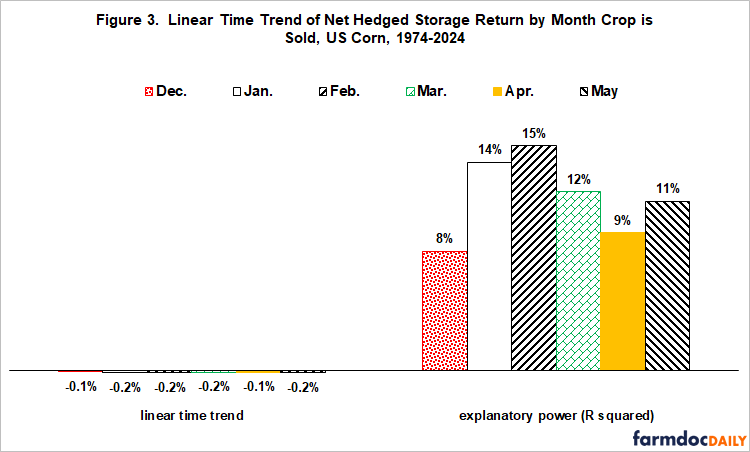
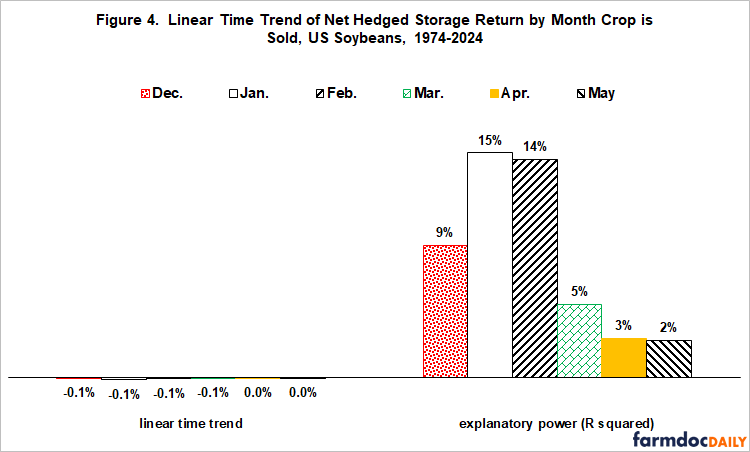
The annual time trends of net returns to hedged storage are negative for all corn and soybean storage periods (left side of Figures 3 and 4), although close to zero for soybean storage to April and May. Explanatory power is low, but higher than for cash storage of corn and for cash storage of soybeans at shorter periods. For corn, statistical significance exceeds 95% confidence for all six storage periods and 99% confidence for October-January and October-February. For soybeans, statistical significance is less. Confidence exceeds 95% for October-December and 99% for October-January and October-February. Although mixed, these results do not statistically rule out a downward trend in net returns to hedged storage of corn and soybeans. Economic significance is likely because an annual time trend accumulates. Specifically, an annual trend of -0.1% becomes -1% over 10 years.
Summary Discussion
This study finds no evidence that net return to cash storage of US corn and soybeans has declined. A decline in net return to futures hedge storage cannot be ruled out as the evidence is not definitive.
A common storyline is that increasing South American production is reducing net return to US storage of corn and soybean (for example, Frechette), but it seems unlikely that South American production would only impact returns to hedged storage.
A more likely explanation for the different time trend behaviors of cash and hedged storage of US corn and soybeans is the increased share of US storage capacity that is off-farm (see Figure 5, which uses data from QuickStats). Off-farm’s share has grown since the late 1990s. Faster growth in off-farm storage capacity implies more competition in the off-farm storage market, which usually implies lower returns. Accepted conventional knowledge is that hedged storage is the dominate strategy used by commercial storers and other first handlers. When combined, these observations imply downward pressure on the returns to hedged storage of US corn and soybeans during the 21st Century.

Since off-farm’s share of US storage capacity started to increase in the late 1990s, a reasonable hypothesis to investigate is whether new biofuel refining facilities are responsible for the faster growth in US off-farm storage.
References and Data Sources
Frechette, D. L. 1997. The Dynamics of Convenience and the Brazilian Soybean Boom. American Journal of Agricultural Economics 79(November): 1108-1118.
US Department of Agriculture, National Agricultural Statistics Service. September 2025. QuickStats. http://quickstats.nass.usda.gov/
Zulauf, C. “Net Return to Storing US Corn and Soybeans Since 1973.” farmdoc daily (15):185, Department of Agricultural and Consumer Economics, University of Illinois at Urbana-Champaign, October 8, 2025.
Zulauf, C., N. Paulson and J. Janzen. “Annual Cost of Storing US Corn and Soybeans Since 1973.” farmdoc daily (15):181, Department of Agricultural and Consumer Economics, University of Illinois at Urbana-Champaign, October 2, 2025.
Disclaimer: We request all readers, electronic media and others follow our citation guidelines when re-posting articles from farmdoc daily. Guidelines are available here. The farmdoc daily website falls under University of Illinois copyright and intellectual property rights. For a detailed statement, please see the University of Illinois Copyright Information and Policies here.