


What Caused the U.S. Ethanol Boom?
The U.S. experienced a major ethanol boom between roughly 2004 and 2011, with production nearly quadrupling from 3.4 to 13.3 billion gallons. By far the most common explanation for the cause of the ethanol boom is the Renewable Fuel Standard (RFS) mandates that were first passed in 2005 (RFS1) and then amended in 2007 (RFS2), with a particular emphasis on the increased level of mandates in the second. This is implicit in calls to waive the RFS mandates during periods of spiking grain prices, in an effort to relieve stress on livestock feeders and food consumers. The argument is simple: the mandates are responsible for rising ethanol production, and this puts upward pressure on grain prices; and consequently, waiving the mandates should help to reduce upward pressure on grain prices during periods of drought or other major market disruptions such as the Ukraine-Russia war (e.g., Carter and Miller, 2012). There is an alternative explanation for the ethanol boom that has received far less attention—the effective banning of MTBE (methyl tertiary-butyl ether) as an oxygenate and octane additive in gasoline that occurred in the U.S. during the early 2000s (Anderson and Elzinga, 2014). The purpose of this article is to investigate the timing of investment in U.S. ethanol plants and provide evidence about which of these explanations for the ethanol boom is most plausible.
Analysis
We begin the analysis with Figure 1, which shows the number of operating ethanol plants in the U.S. over 1998 through 2013. This data was kindly provided by the Renewable Fuels Association (RFA). In the late 1990s, there were around 50 operating ethanol plants, which doubled to more than 100 in 2006, and continued to rise rapidly until reaching a peak of 211 in 2012. The chart also highlights 2000-2003, which is the period when most state-level MTBE bans were put in place. The chart also marks the dates when the two RFS laws passed, August 2005 for RFS1 and December 2007 for RFS2. Figure 1 suggests that MTBE bans were not as important as RFS1 and RFS2 for stimulating investment in ethanol plants. In the two years following the MTBE bans (2004-2005), 23 ethanol plants began operation. By comparison, in the two years following RFS1 44 plants began operation. Similarly, 50 plants began operation in the two years following RFS2.
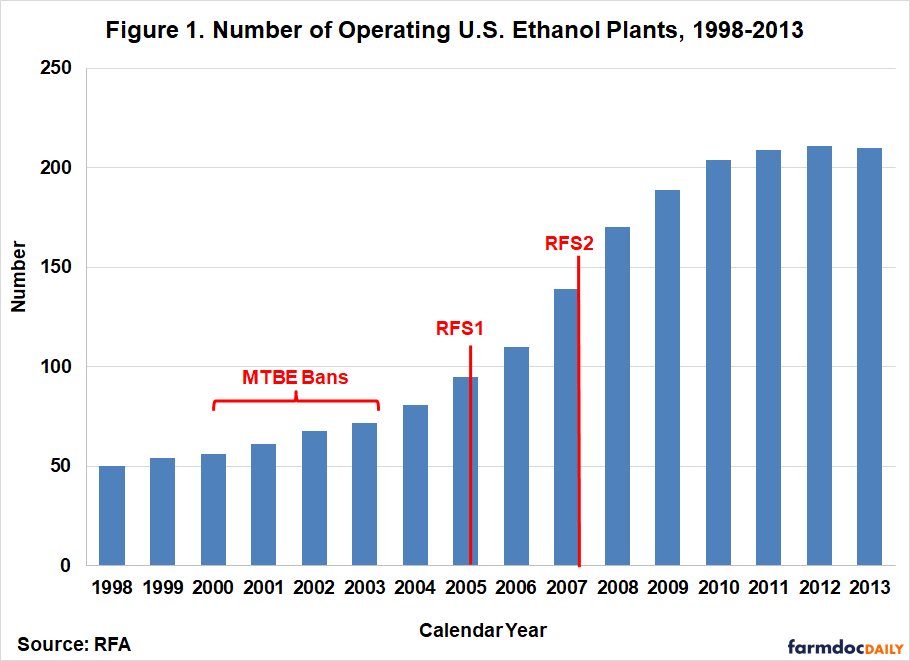
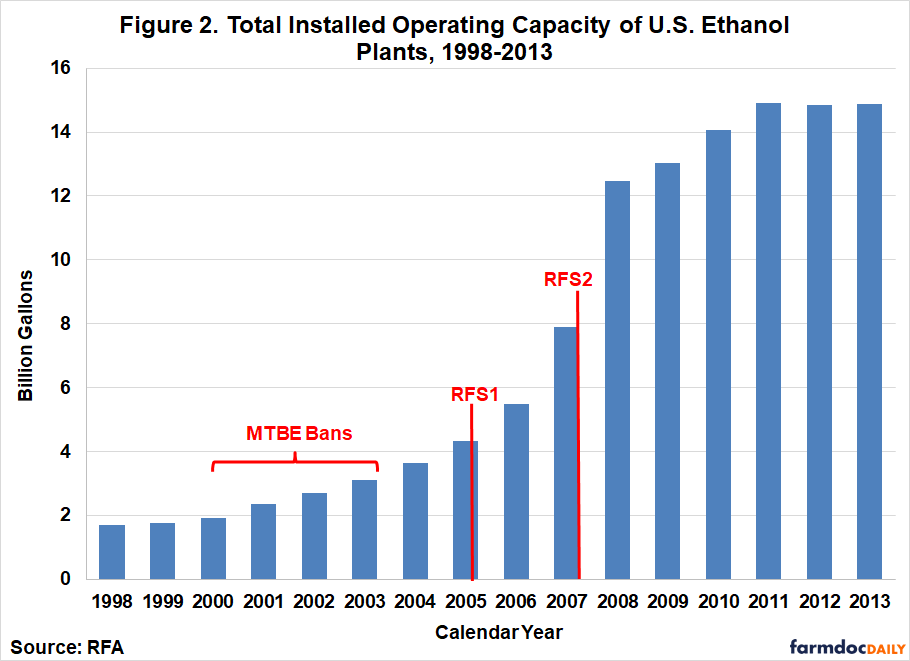
Figure 2 provides additional perspective by showing the total operating capacity of new ethanol plants from 1998 through 2013. This data suggests even more strongly that the two RFS laws were most important, consistent with conventional wisdom. For example, in the two years after passage of RFS2 total operating capacity of new ethanol plants increased over five billion gallons. In contrast, the capacity of new ethanol plants increased only about one billion gallons in the two years following the MTBE bans.
The evidence provided so far suggests the RFS mandates were more important than MTBE bans in driving the U.S. ethanol boom from 2004 through 2011, as the number and capacity of new ethanol plants increased more quickly following the passage of the RFS mandates compared to the period following MTBE bans. However, it is important to recognize that the data in Figures 1 and 2 are based on the initial year that operation started for a new ethanol plant. This raises the fundamental question of how to define “investment” in the context of building a new ethanol plant.
It should not be surprising that the process of building an ethanol plant is quite complex in practice. Based on investment prospectuses, articles in the trade press, and discussions with investors in the ethanol industry, a representative timeline for building a new ethanol plant can be developed as follows:
- Phase 1. Pre-Development & Feasibility (6-12 months): Site selection and evaluation, grain origination studies, preliminary engineering analysis, and formation of partnerships/cooperatives/investor groups.
- Phase 2. Financing (6-18 months): Raising equity, debt financing arrangements, and state and federal grant applications.
- Phase 3. Permitting (6-18 months): Environmental permits (air quality, water, waste), state operating permits, local zoning and construction permits, and EPA reviews.
- Phase 4. Engineering & Design (3-6 months): Engineering drawings, equipment specifications, technology licensing agreements, and contractor selection.
- Phase 5. Construction (18-24 months): Site preparation, tank and structural installation, process equipment installation, electrical and instrumentation, and piping and mechanical systems.
- Phase 6. Commissioning & Startup (2-4 months): Equipment testing, trial runs, staff training, and production ramp up.
This suggests that the entire process from project initiation to operation takes at least three to five years. The critical question is where in this three-to-five-year timeline does “investment” in an ethanol plant actually take place? In economics, the textbook definition is that investment occurs when capital expenditures are made, not when the capital good is physically installed or becomes productive. This timing convention follows several key principles for fixed capital investment. Specifically, investment is accounted for when: i) the purchase/sale transaction for the capital good takes place, ii) ownership legally transfers, and iii) the expenditure for the capital good is made. In short, the rule when defining investment is literally “show me the money.”
The textbook economic definition of investment clearly demonstrates that equating ethanol plant startup dates with investment does not make sense. The timeline presented above indicates that plant construction takes 18-24 months, and this time period is undoubtedly the period of heaviest expenditures. At the same time, given lags in ordering capital equipment, some expenditures certainly occur in advance of construction, which would lengthen the lag between investment and plant startup even further. A reasonable compromise is to assume that, on average, investment in a new ethanol plant occurs two years prior to startup.
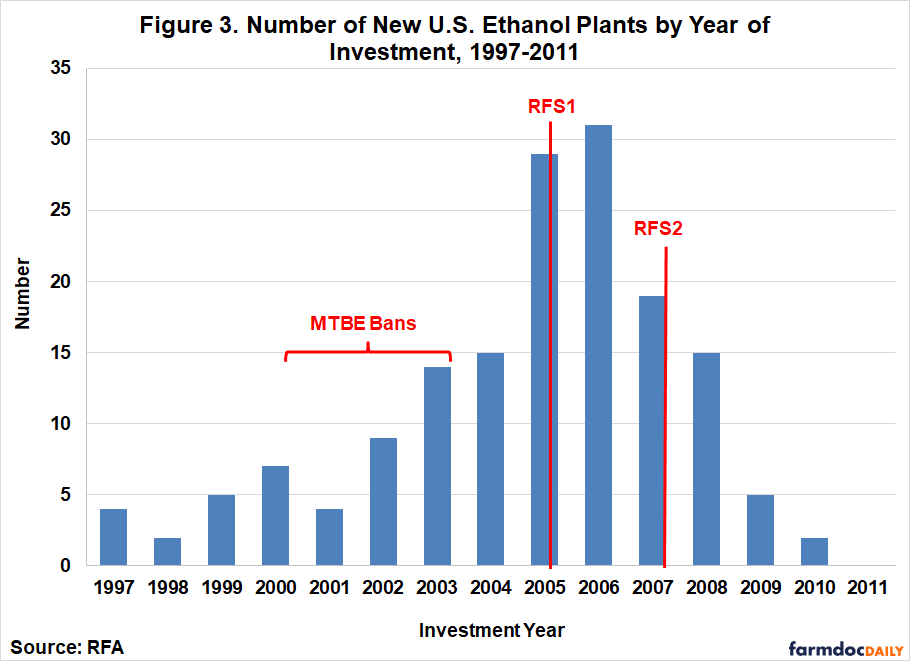
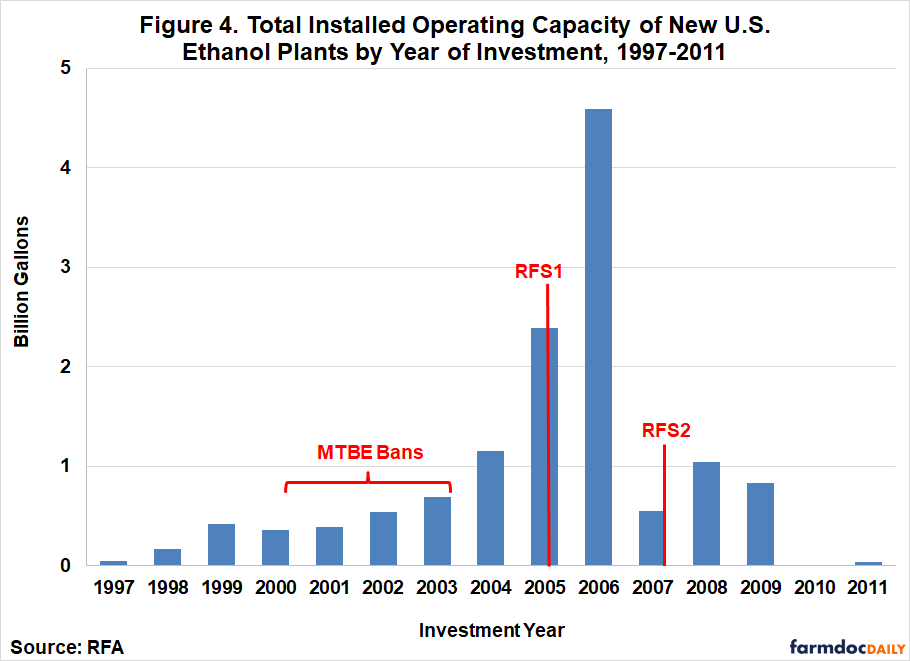
Defining plant investment in this manner has a dramatic effect on the timing of the ethanol boom relative to the policy drivers under consideration. Figure 3 shows the number of new ethanol plants in the U.S. by year of investment, which is defined as two years before a plant begins operation. Note that Figure 3 shows the increment of new plants, whereas Figure 1 shows total plants in operation. Investment in 20 new ethanol plants occurred in the two years after passage of RFS2. By contrast, investment in 44 new plants occurred in the two years after MTBE bans and 50 the two years following passage of RFS1. Figure 4 shows the operating capacity of new ethanol plants using the same rule for year of investment. The results are even more striking, with investment in 3.5 billion gallons of new capacity following the MTBE bans and over 5 billion gallons following RFS1. Investment in less than 2 billion gallons of new capacity occurred in the two years following the passage of RFS2.
The change in timing for defining ethanol plant investment suggests a different conclusion than what was reached earlier: the main driver of the ethanol boom was the effective ban on MTBE and its codification in RFS1. Anderson and Elzinga (2014, pp. 260) provide a useful summary of how this process played out:
“By the late 1990s, some cities noticed that MTBE, a suspected carcinogen, was contaminating their drinking water. Because this problem was most pronounced in RFG areas, it was clear that the cause was leakage of fuel from underground gasoline storage tanks. Thus, starting around 2000, a number of states began to ban MTBE, and pressure built for a national ban (U.S. Energy Information Administration, 2003). Meanwhile, the fuel industry sought liability protection from MTBE-related lawsuits, arguing that they had been compelled to blend MTBE by federal regulation. When the Energy Policy Act of 2005 failed to grant such protection, the industry treated this failure as an implicit ban and opted to phase-out MTBE completely by the summer of 2006 (U.S. Energy Information Administration, 2006).”
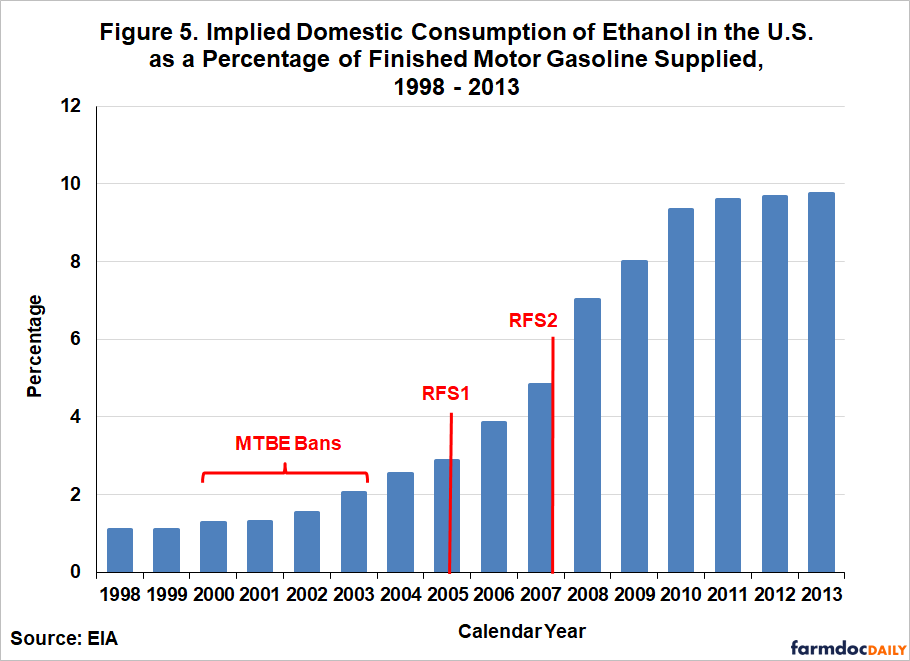
The bottom-line is that the banning of MTBE had a significant impact on the composition of gasoline blends in the U.S. Figure 5 provides direct evidence. It shows that the annual blend rate for ethanol began increasing in parallel with state-level MTBE bans and well in advance of the passage of either of the two RFS laws. In 2000, the blend rate was just 1.3 percent, ticked up to 2.1 percent by 2003, and increased to 2.9 percent in 2005. It is clear that the transition to ethanol as an oxygenate and octane additive replacement for MTBE was well underway before RFS1 was passed in August 2005. The blend rate reached 4.8 percent in 2007 and jumped again to 7.0 percent in 2008. This once again demonstrates that RFS2 played at most a secondary role in the U.S. ethanol boom.
Implications
The boom in U.S. ethanol production between 2004 and 2011 was one of the biggest developments in agricultural and fuel markets of the last 50 years. Conventional wisdom is that the boom was driven by passage of the Renewable Fuel Standard (RFS) mandates in 2005 (RFS1) and 2007 (RFS2), with a particular emphasis on the increased level of mandates in the second. However, a careful examination of the timeline of ethanol plant investment reveals that the conventional wisdom about the cause of the U.S ethanol boom needs to be revised. When we properly account for the lag between investment decisions and the start of plant operations, it becomes clear that the phase-out of MTBE in the early 2000s and its codification in RFS1—not RFS2—was the primary policy driver of ethanol plant construction during the U.S. ethanol boom.
This revised understanding of the ethanol boom has important implications for policy debates and our approach to analyzing agricultural and energy markets. First, it calls into question the common argument that waiving or reducing RFS mandates would provide significant relief during periods of high grain prices. If the primary driver of ethanol production growth is the MTBE phase-out rather than RFS2 mandates, then the mandates are unlikely to be binding in terms of ethanol demand, and a waiver will have limited, if any, effectiveness in reducing ethanol use and grain prices. Second, the analysis highlights the importance of carefully identifying the timing of policy impacts when evaluating their effects on markets. Simply observing that ethanol production increased after RFS2 was passed does not prove causation—the production increases were set in motion by earlier policy changes. This matters not just for understanding the ethanol boom, but to how we approach any analysis of policy impacts on agricultural markets. When major changes occur following multiple policy interventions, properly accounting for investment lags and market adjustment dynamics is essential for distinguishing correlation from causation. Finally, this case illustrates how unintended consequences of environmental regulations (the MTBE ban) can have far-reaching effects in agricultural markets that dwarf the impact of more explicit agricultural policies like the RFS mandates.
References
Anderson, S.T., and A Elzinga. 2014. “A Ban on One is a Boon for the Other: Strict Gasoline Content Rules and Implicit Ethanol Blending Mandates.” Journal of Environmental Economics and Management 67(3):258-273. https://doi.org/10.1016/j.jeem.2013.11.009
Carter, C.A., and H.I. Miller. “Corn for Food, Not Fuel.” New York Times, July 30, 2012. https://www.nytimes.com/2012/07/31/opinion/corn-for-food-not-fuel.html?_r=2&ref=todayspaper
Disclaimer: We request all readers, electronic media and others follow our citation guidelines when re-posting articles from farmdoc daily. Guidelines are available here. The farmdoc daily website falls under University of Illinois copyright and intellectual property rights. For a detailed statement, please see the University of Illinois Copyright Information and Policies here.