


The Dramatic Change in US Ag Land Price-Rent Ratio
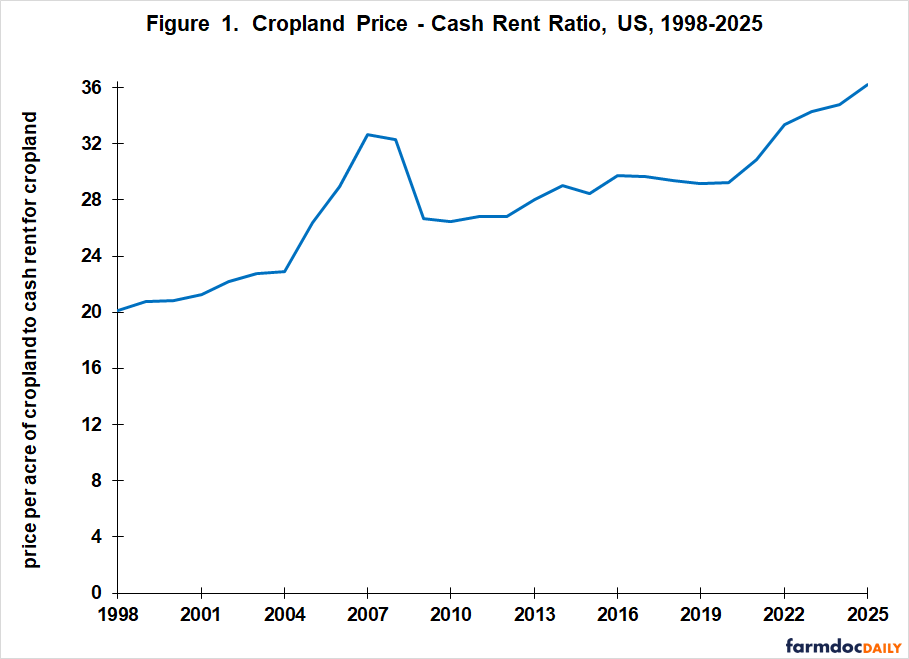
The ratio of US cropland price to cropland cash rent has nearly doubled since 1998, from 20 to 36 (see Figure 1). Empirical analysis so far has not identified any statistically significant explanatory factor, so this article’s purpose is to call attention to this dramatic change. To put the change in perspective, if the ratio had remained at 20, the current average price of US cropland would be $3,244, 44% below its 2025 value of $5,830. Source for the data in Figure 1 is QuickStats (USDA, NASS (US Department of Agriculture, National Agricultural Statistics Service)).
Longer Perspective
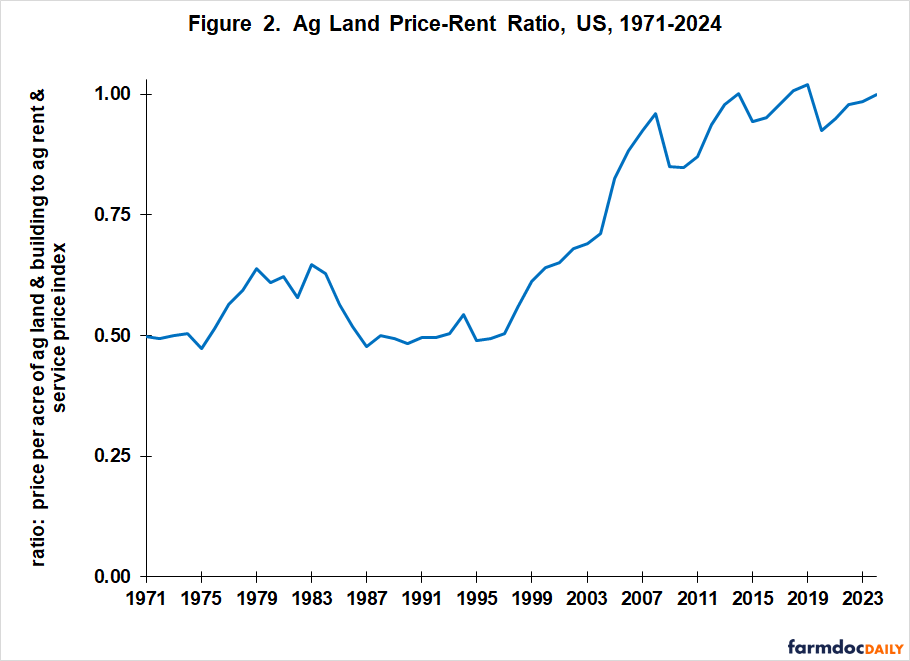
To provide a longer perspective, ratio of the price per acre of US ag land & buildings to the US ag rent & services index is calculated. Both are available from QuickStats starting with 1971, first year for the rent & services index. This ratio’s numerator and denominator contain non-land components, and ag land includes more than cropland. Nevertheless, it provides a useful longer perspective. To aid in interpretation, both variables are indexed to their 2024 value (last available year). The ratio for 2024 is thus 1.0. It averaged 0.54 over 1971-1995, nearly half its current value. Correlation of the ratios in Figures 1 and 2 over their common period, 1998-2024, is +0.89 (+1.0 is perfect correlation). Correlation of year-to-year changes in the two ratios is +0.69, which is usually considered high for variables measured as change. In short, the paths of the two ratios since 1998 are generally similar.
Analysis
The upward trend in Figure 2’s ratio started in the mid-1990s. In addition, there are a 4 year period and a 5 year period when the ratio jumped higher: 1976 (0.51) to 1981 (0.62) and 2004 (0.71) to 2008 (0.96). A correction followed both jumps. The earlier correction held for many years while the later correction held for only a few years. The jump between 2004 (23) and 2008 (32) is also evident in Figure 1. In both figures, a notable jump occurred post 2020, although it is unclear if the jump In Figure 2 is within its post 2012 range. A potential explanation for the 1976-1981 jump is the crop prosperity from 1973 to 1981. A potential explanation for the 2004-2008 jump is the public debate, enactment, and initial implementation of the RFS (Renewable Fuels Standards). If sustained, the jump since 2020 overlaps the expanding use of soy diesel. In addition, since the mid-1990s, interest rates, both nominal and real inflation adjusted, have trended lower.
Despite the above stories, neither private market return for the cost of production crops at harvest, nor industrial use of corn, sorghum, and soyoil, nor nominal or real interest rate measures are statistically significant explanatory variables of the year-to-year changes in either price-rent ratio (see Data Note 1). Because a definite trend exists in the ratios, statistical considerations suggest that changes in the ratios, not their level, should be analyzed. Other potential explanatory variables, including farm safety net program payments, were examined. None are statistically significant.
Summary Observations
A strong upward trend in the US agricultural land price-rent ratio has been on-going since the mid-1990s. If the ratio had not increased, current US cropland prices could be 40% or so lower.
Analysis so far has not identified any statistically significant explanatory variable for the year-to-year change in the agricultural land-rent ratios examined in this article.
Given land’s large share of US farm assets (roughly 80%), it is important that identification of the factors underlying the increasing agricultural land-rent ratio receive attention.
Data Note 1
The nine US cost of production crops are barley, corn, cotton, oats, peanuts, rice, sorghum, soybeans, and wheat. The calculation of private market returns at harvest and farm safety net payments used in this analysis is discussed in detail in the April 11, 2025 farmdoc daily. The data on industrial use of corn, sorghum, and soyoil come from the PSD (Production, Supply, and Distribution) database maintained by USDA, Foreign Agriculture Service. Data on interest rates are from the St. Louis Federal Reserve Bank FRED database and from the Federal Reserve Bank of Kansas City.
References and Data Sources
Federal Reserve Bank of Kansas City. December 2025. Data: Fixed Interest Rates. https://www.kansascityfed.org/agriculture/ag-credit-survey/
Federal Reserve Bank of St. Louis. December 2025. Federal Reserve Economic Data (FRED). https://fred.stlouisfed.org
US Department of Agriculture, Foreign Agriculture Service. December 2025. Production, Supply, and Distribution Online. https://apps.fas.usda.gov/psdonline/
US Department of Agriculture, National Agricultural Statistics Service. December 2025. QuickStats. http://quickstats.nass.U.S.da.gov/
Zulauf, C., J. Coppess, G. Schnitkey and N. Paulson. “Demise of the US Countercyclical Crop Safety Net.” farmdoc daily (15):68, Department of Agricultural and Consumer Economics, University of Illinois at Urbana-Champaign, April 11, 2025.
Disclaimer: We request all readers, electronic media and others follow our citation guidelines when re-posting articles from farmdoc daily. Guidelines are available here. The farmdoc daily website falls under University of Illinois copyright and intellectual property rights. For a detailed statement, please see the University of Illinois Copyright Information and Policies here.