


Forecasting US Field Crop Sector Prosperity
This article presents a model to forecast net return at harvest for the nine field crops that USDA, ERS (US Department of Agriculture, Economic Research Service) computes an economic cost of production. Three variables have a combined explanatory power of 79%: last year’s percent net return at harvest, last year’s average return to storing US corn and soybeans, and the ratio of beginning world stocks to last year’s use of the nine crops. These variables forecast a percent net return at 2025 harvest of -20%. This compares with -17% at 2024 harvest. Forecasted total net loss for the nine crops combined is $36.4 billion. The next article will address the policy question of how large crop safety net payments should be in 2025, including the need for any additional ad hoc assistance.
Private Market Net Returns Since 1975
Figure 1 presents the yearly time path of aggregate private market returns at harvest since 1975 for the nine cost of production (COP) crops as a group. These crops are barley, corn, cotton, oats, peanuts, rice, sorghum, soybeans, and wheat. For a discussion of the data and methods used to construct Figure 1, see the farmdoc daily of April 11, 2025, especially the data notes.
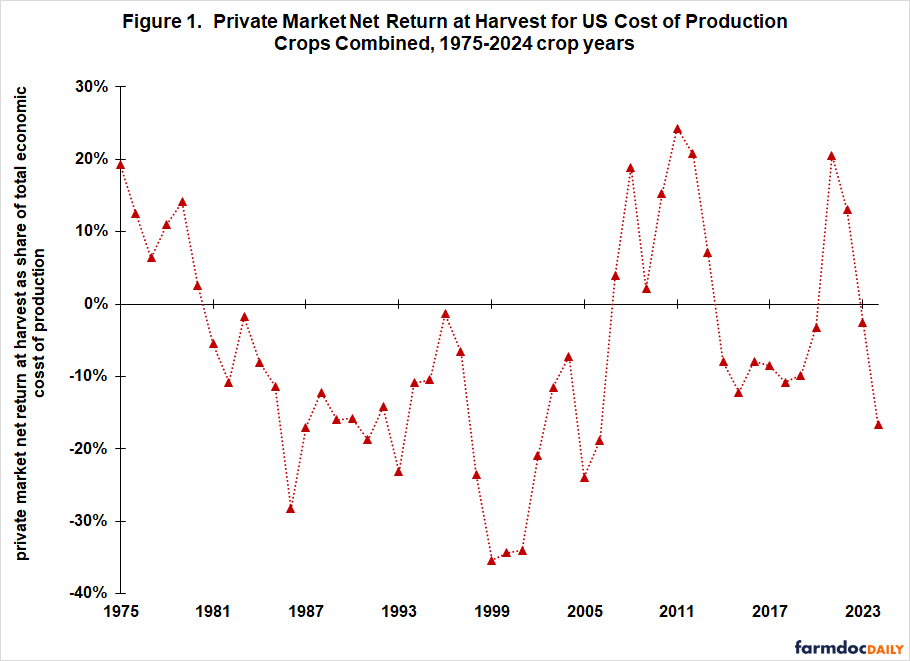
Four distinct periods are evident. During 1975-1980, private market net return at harvest as a share of total economic cost of production, hereafter percent profitability, was positive for the COP crops as a group in all 6 years, averaging 11% / year. This extended prosperity coincided with an export boom. Second, during 1981-2006, private market percent profitability was negative in all 25 years, averaging -16% / year. Third, during 2007-2013, percent profitability was positive in all 7 years, averaging 13% / year. This extended prosperity coincided with the early years of the RFS (Renewable Fuels Standard). Fourth, since 2014, percent profitability has been negative in 9 of 11 years, averaging -4% / year. Over the entire 1975-2024 period, private market percent profitability at harvest for the nine COP crops combined averaged -6% / year, ranging from -35% in 1999 to +24% in 2011.
Forecasting Future Net Return at Harvest
Figure 1 reveals persistence in private market percent profitability at harvest. Persistence implies that, If percent profitability was positive (negative) last year, it will likely remain positive (negative). Last year’s percent profitability is thus an obvious predictor variable for this year’s percent profitability.
A second likely variable is last year’s percent net return to storage. Return to storage is an indicator of the relative balance between supply and demand. Positive returns to storage occur when demand increases relative to supply, drawing down stocks. Negative returns occur when supply increases relative to demand, adding to stocks. Net storage return is measured as the average net return to storing US corn and soybeans from October to August of the prior crop year using data and methods discussed in the farmdoc daily of October 8, 2025. Corn and soybeans account for roughly 72% of US acres planted to the nine COP crops in 2025.
Another potential indicator of supply-demand balance is the ratio of beginning stocks to use. The higher is this ratio, the more past supply is available to meet current demand, implying downward pressure on price and net return, assuming no change in other factors. Use and beginning stocks are from PSD (Production, Supply, and Distribution Online, USDA, Foreign Agriculture Service).
Estimated Explanatory Model
A multiple variable regression analysis was conducted using the variables discussed above. Each is statistically significant with at least 97% confidence (see Table 1). World, not US, beginning stocks-to-use is used as an explanatory variable. US stocks-to-use is not statistically significant even at 90% confidence, the lowest value commonly-used for determining if a variable is statistically significant.
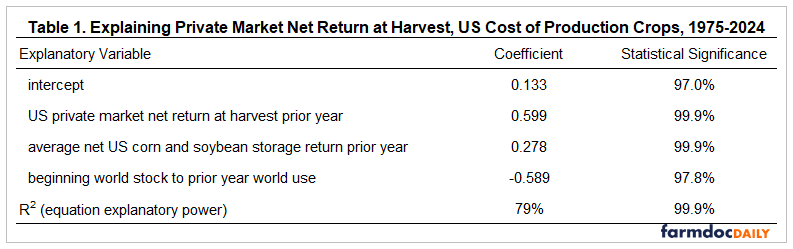
The sign of all explanatory variables is consistent with the discussion in the preceding section. Taken together, they explained 79% of the year-to-year variation in private market net return at harvest for the US COP crops as a group since 1975.
The coefficient on last year’s net return (0.599) is less than 1, implying large negative and positive net returns will tend to more toward $0. This is consistent with economic theory, which suggests that, over time, net return above all economic costs of production should be close to $0 in competitive markets such as field crop production.
Given the importance of the prior year’s return and the data presented in Figure 1, an obvious question is whether returns for earlier years are also significant explanatory variables. Including private market return at harvest for two years past (for example, 1975 return for 1977 return) did not significantly increase explanatory power of the equation in Table 1.
An important empirical issue in regression analysis is whether the explanatory variables are closely related to one another and thus providing the same information. The largest degree of correlation between each pair of the three explanatory variables in Table 1 is -0.20 between world stocks-to-use and average net storage return to US corn and soybeans. These low correlations suggest the three variables are not providing overlapping information in this analysis.
Forecasting 2025 Net Return at Harvest
A value is currently available for each explanatory variable in Table 1’s equation to estimate a private market net return at 2025 harvest. US private market net return at 2024 harvest was –17%. Average US net return to storing corn and soybeans during the 2024 crop year was -27%. The ratio of beginning stocks for the 2025 crop year to use during the 2024 crop year was 27%. Plugging these values into Table 1’s equation results in a projected 2025 net return at harvest as a ratio of total economic cost of production of -20%, slightly lower than the -17% at 2024 harvest. The dollar value forecast is a combined loss to the nine COP crops of $36.4 billion.
Discussion
A highly statistically significant year-to-year persistence is found in net returns at harvest to producing the nine US COP crops as a group. Thus, last year’s percent profitability is a good starting place for forecasting the current year’s percent profitability.
Net returns to storing US corn and soybeans is also a statistically significant explanatory variable. In a sense, it is an early indicator of whether net year’s return will be higher, lower, or remain about the same as the current year’s return.
Beginning world stocks to prior year’ world use, but not beginning US stocks to prior year US use, is the third statistically significant explanatory variable. This finding implies that world stocks are more important to understanding US field crop prosperity than are US stocks.
The regression equation estimated in this analysis along with the available data for 2024 suggest a slightly lower private market return at 2025 harvest than at 2024 harvest (-20% vs. -17%). Substantial payments were made to farmers for 2024 crops and substantial payments will be made to farmers for the 2025 crop. In the next article, we will discuss the policy question of what should be the level of payments by the farm safety net, both for 2025 and in general.
References and Data Sources
US Department of Agriculture, Economic Research Service. December 2025. Cost of Production. https://www.ers.usda.gov/data-products/commodity-costs-and-returns/
US Department of Agriculture, Foreign Agriculture Service. December 2025. Production, Supply, and Distribution Online. https://apps.fas.usda.gov/psdonline/
US Department of Agriculture, National Agricultural Statistics Service. March 2025. QuickStats. https://quickstats.nass.usda.gov/
Zulauf, C. “Net Return to Storing US Corn and Soybeans Since 1973.” farmdoc daily (15):185, Department of Agricultural and Consumer Economics, University of Illinois at Urbana-Champaign, October 8, 2025.
Zulauf, C., J. Coppess, G. Schnitkey and N. Paulson. “Demise of the US Countercyclical Crop Safety Net.” farmdoc daily (15):68, Department of Agricultural and Consumer Economics, University of Illinois at Urbana-Champaign, April 11, 2025.
Disclaimer: We request all readers, electronic media and others follow our citation guidelines when re-posting articles from farmdoc daily. Guidelines are available here. The farmdoc daily website falls under University of Illinois copyright and intellectual property rights. For a detailed statement, please see the University of Illinois Copyright Information and Policies here.