


US Grain Storage Capacity Growth Has Stopped
Grain storage infrastructure including bins, elevators, bunkers, and sheds, allows farmers, grain merchants, and others to take advantage of price differences across time, storing grain when it is relatively cheap and bringing it to market when it is more valuable. Storage also facilitates grain aggregation and movement to end-users. Thus, storage infrastructure is critical to the effective operation of US grain supply chains and the efficiency of US grain markets. Robust grain storage infrastructure allows farmers to receive the highest possible price for their crops, conditional on demand.
The US generally has sufficient grain storage infrastructure, but there are concerning changes in recent storage capacity data. For about twenty years, from 2000 to 2019, grain storage capacity grew in lock step with increases in US grain production. This parallel growth implied capacity was ‘right sized’ for existing grain supply chains. Since 2020, capacity growth has disappeared. While crop production continues to rise, storage capacity both on farm and off farm has remained roughly constant. This change holds across all major grain growing regions.
Less storage capacity relative to crop production is concerning if it creates bottlenecks in the grain handling and transportation system that raise costs and generate significant differences in price between producer and end-user. In transportation for example, shipping constraints on the Mississippi River waterway due to low water levels have periodically led to large swings in inland crop prices relative to prices at export terminals (Flores and Janzen, 2023). This year’s large US corn crop has led to record high US storage capacity utilization, particularly in on-farm storage. Recently released data showed 80% of on-farm storage capacity was used by major crops as of December 1, 2025. Stagnant capacity growth raises at least two unanswered questions for the US grain industry from the farmer forward through the supply chain: i) how much capacity utilization is too much before capacity constraints disrupt supply chains and affect market prices? and ii) who will invest in new storage capacity if increases in crop production are expected to continue?
Capacity Growth Stopped
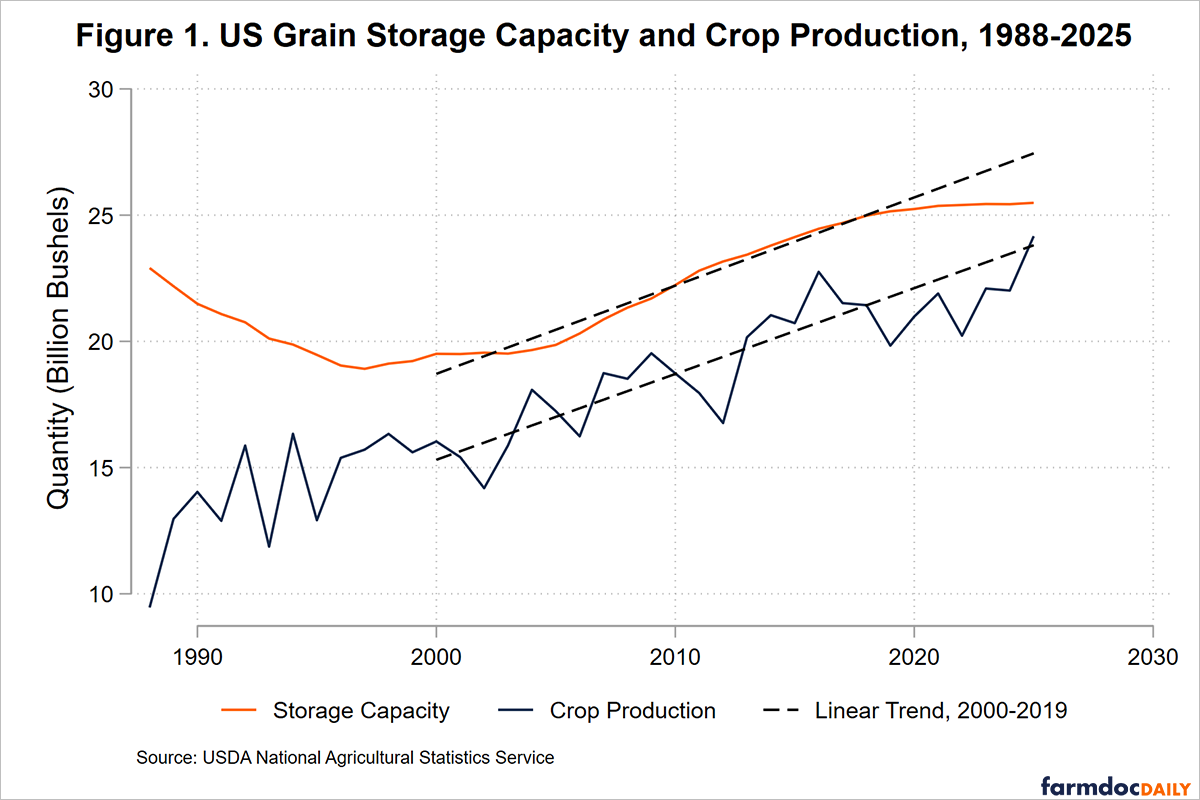
An earlier farmdoc daily article (Janzen and Swearingen, 2020) described changes in US grain storage capacity over time. It showed US grain storage capacity as reported by USDA’s National Agricultural Statistics Service grew by an average of 349 million bushels per year between 2000 and 2019 as shown in Figure 1. This growth followed a period of rationalization in the 1990s where storage capacity shrank. By 2019, total US grain storage capacity was just over 25 billion bushels. US grain production growth was remarkably similar to storage capacity growth over this earlier period. Total production of crops that can plausibly use grain storage infrastructure (whose inventories are estimated in the USDA NASS Quarterly Grain Stocks report, namely barley, canola, chickpeas, corn, flaxseed, lentils, mustard, oats, peas, rye, safflower, sorghum, soybeans, sunflower and wheat) was typically 2.5-5 billion bushels less than total storage capacity. Average annual production growth was about 340 million bushels per year, remarkably similar to storage capacity growth as indicated by the parallel linear trends in Figure 1.
After 2019, these parallel trends have diverged. Grain storage capacity growth has been negligible, increasing only 337 million bushels in six years, or less than what occurred in an average year previously. Had capacity growth continued its linear trend shown in Figure 1, the US would now have 27.5 billion bushels of grain storage capacity. One might argue that the end of growth was a prescient response to a slowdown in production growth as national grain production was below trend every year between 2019 and 2024. However, the 2025 US crop was large, mainly on the strength of record corn yields and historically elevated corn acreage (Franken and Janzen, 2025) and crop production is closer to total capacity this year than any since 1988. Surplus aggregate storage capacity (capacity in excess of production) was just 5% in 2025, well below the average level of 15% observed since 2000.
It is hard to assess how restrictive the grain storage capacity constraint is in the US. First, not all production is harvested at once, so the same storage facilities may handle multiple bushels per year, especially in areas where early harvested crops like wheat are produced alongside late harvested crops like corn. Farmers and grain merchants can also temporarily exceed storage capacity through alternative storage methods like bags and ground piles. However, location of grain storage infrastructure is fixed in the short-run and may not be near to production, transportation, or end-use locations. Depending on the origin and destination of US crop output, local capacity bottlenecks may be more or less likely.
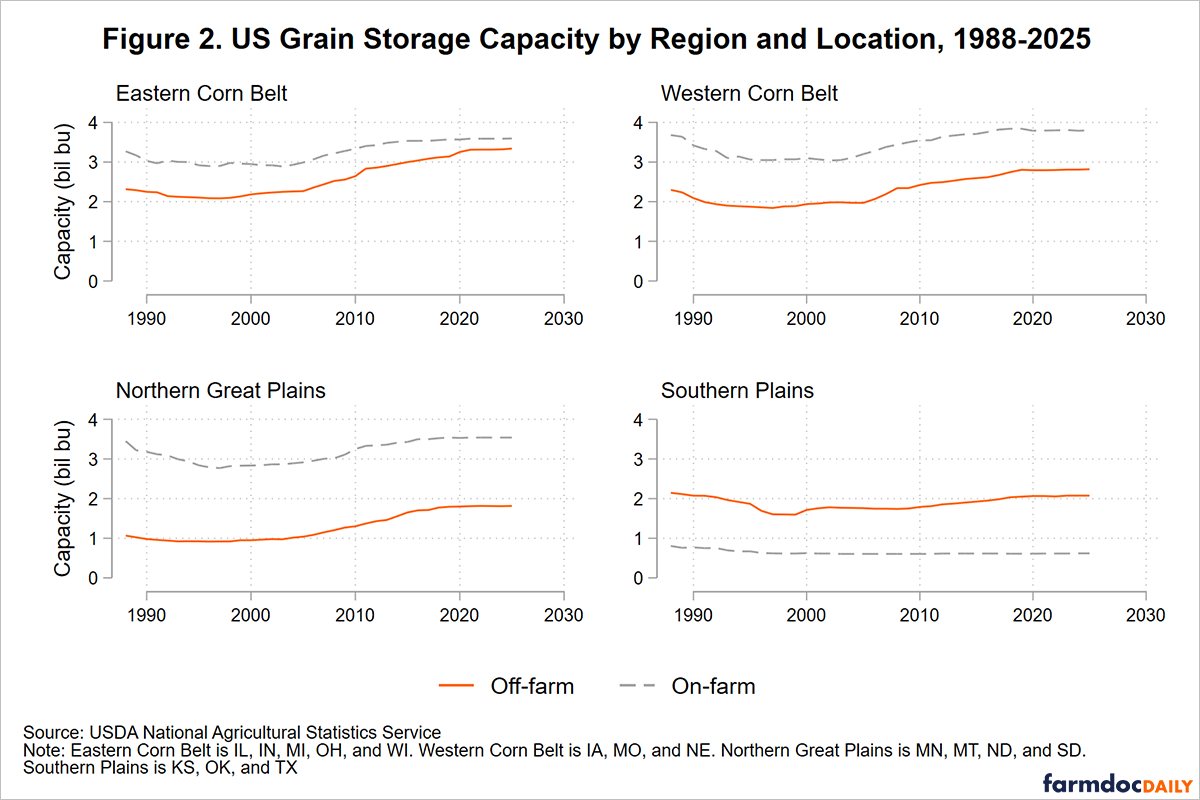
The location and amount of grain storage capacity varies across regions, especially the share of grain storage capacity on farms. Figure 2 shows on-farm and off-farm storage capacity for four broad regions that comprise a large share of US grain production. There is proportionally more on-farm storage capacity in the Western Corn Belt and Northern Great Plains, regions generally further from end-users with relatively weaker cash commodity prices. During the storage capacity growth period of 2000-2019, off-farm capacity grew more rapidly than on-farm capacity suggesting a growing role for intermediaries in the grain handling and transportation system. However, growth in capacity since 2020 has come to a halt at all locations. Both farmers and grain handlers are limiting investment in new capacity. What is clear from Figures 1 and 2 is that storage capacity constraints are likely closer to becoming a real constraint now than at any time in recent memory.
Capacity Utilization Has Increased
To examine how US grain storage capacity is used, I calculate a measure of storage capacity utilization based on quarterly grain inventory data from USDA NASS. Capacity utilization is grain inventory in each quarter as a percentage of annually updated capacity. Inventories data here include only major grains and oilseeds – barley, corn, oats, sorghum, soybeans, and wheat – for which stocks data are reported in all quarters. However, these commodities account for the lion’s share of total inventories.
Much of the variation in crop inventory is seasonal. Inventories peak immediately after harvest, especially on-farm, and are moved off-farm and drawn down through the marketing year as commodities move to end-users. Changes in capacity utilization across years are mainly driven by changes in commodity supply. High production years feature the largest inventories and higher capacity utilization.
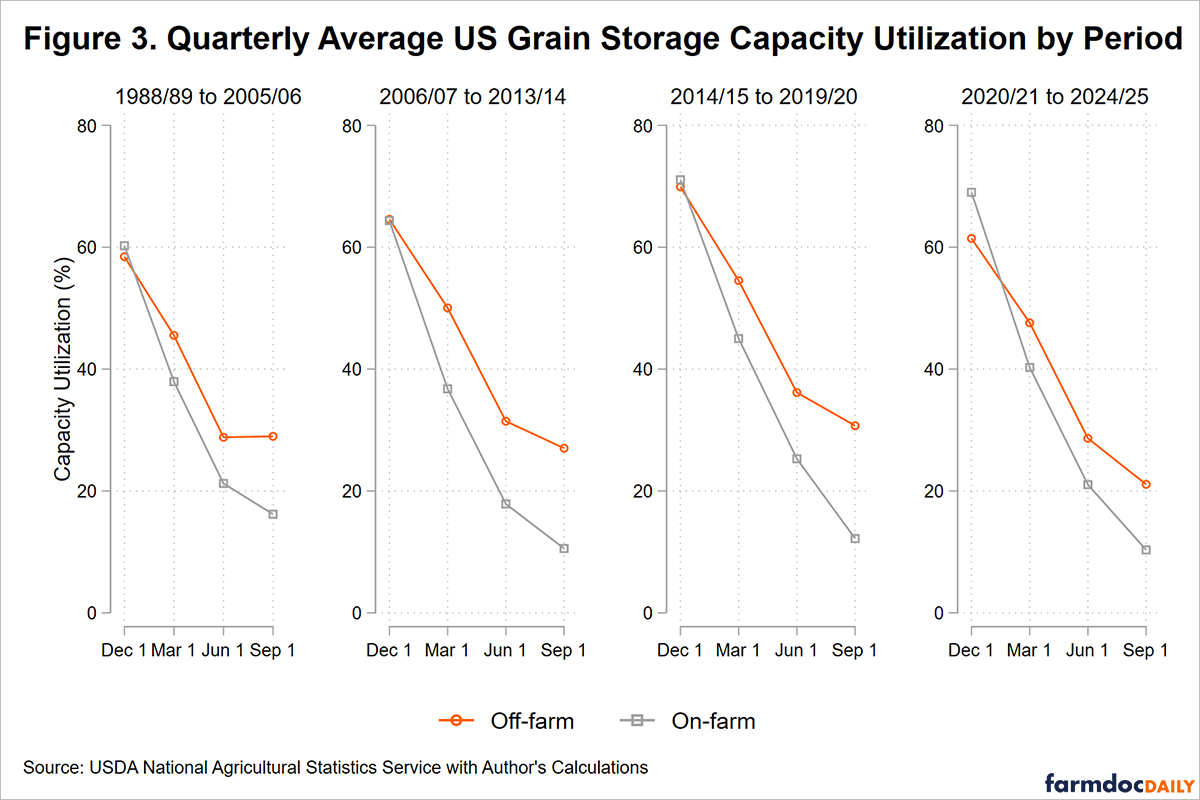
To summarize long-run changes in capacity utilization (as distinct from the short-run drivers discussed above) Figure 3 plots quarterly average capacity utilization for four subperiods since the 1988/89 marketing year. These periods correspond with the initial period of capacity consolidation before 2006, the ethanol boom period of 2006-2014 with higher prices and tighter supply, the low-price environment between 2014-2020, and the most recent years since.
Two points are evident from Figure 3. First, capacity utilization has grown over time. Average capacity utilization at the end of the US grain harvest on December 1 grew from about 60% before 2006 to roughly 70% in the 2020-2025 period. The drawdown in capacity utilization has also increased. Average on-farm storage capacity use at the September 1 low declined from 16% to 10% over the same period, clearing additional storage space to accommodate the incoming harvest.
Second, farmers are taking on more of the initial task of post-harvest commodity storage. On-farm storage capacity use rates were typically like off-farm use prior to 2020. Since then, average on-farm storage capacity utilization is 69% on farm versus 61% off farm. These averages do not include the most recent data point for December 1, 2025, where on-farm capacity was 80% compared to 65% off-farm.
Discussion
US grain storage capacity grew in parallel with production from 2000-2019 at roughly 350 million bushels per year but has stagnated since 2020 across all regions and facility types. This stagnation, combined with continued production growth, has led to record-high capacity utilization rates, particularly in on-farm storage. The 2025 crop brought these tensions to a head with December 1 on-farm utilization reaching 80% of national on-farm storage capacity. What is less clear is why investment in grain storage capacity dropped. Possible relevant factors include increased construction costs and higher interest rates in the post-2020, post-Covid economy, concerns about future production growth, and the irregular and unpredictable nature of grain storage demand. It may be difficult to justify investment in storage capacity when the timing and magnitude of benefits are uncertain. Storage capacity may earn low returns in typical market conditions but become much more valuable in the aftermath of specific supply or demand changes. It takes time and effort for farmers and other firms to consistently generate revenue from storage capacity.
In the aggregate, it is difficult to determine if current US storage capacity is sufficient for efficient operation along grain supply chains. At what level of capacity utilization do bottlenecks form and capacity constraints begin to materially affect basis relationships, price volatility, and farmer marketing flexibility? The grain industry, from the farmer outward, will need to consider these questions as it addresses the continually shifting geography of global grain production and consumption in the years ahead.
References
Flores, I. and J. Janzen. "Drought, Low River Water Levels, and Local Soybean Markets: The Role of Physical and Economic Distance." farmdoc daily (13):61, Department of Agricultural and Consumer Economics, University of Illinois at Urbana-Champaign, April 3, 2023.
Franken, J. and J. Janzen. "Yes, There Are a Lot of Corn Acres: Evidence from FSA Acreage Data." farmdoc daily (15):149, Department of Agricultural and Consumer Economics, University of Illinois at Urbana-Champaign, August 18, 2025.
Janzen, J. and B. Swearingen. "Changes in US Grain Storage Capacity." farmdoc daily (10):204, Department of Agricultural and Consumer Economics, University of Illinois at Urbana-Champaign, November 25, 2020.
Disclaimer: We request all readers, electronic media and others follow our citation guidelines when re-posting articles from farmdoc daily. Guidelines are available here. The farmdoc daily website falls under University of Illinois copyright and intellectual property rights. For a detailed statement, please see the University of Illinois Copyright Information and Policies here.