


Net Interest Margins of U.S. Commercial Banks Participating in Agricultural Lending Widen in the Fourth Quarter of 2025
As of the fourth quarter of 2025, 3,334 commercial banks reported outstanding farm real estate or agricultural production loans, down from 3,470 in the fourth quarter of 2024. Within this group, 933 institutions met the definition of agricultural banks, and 3,304 were classified as community banks. Aggregate agricultural loan balances reached 207.39 billion dollars in the fourth quarter, consisting of 119.79 billion dollars in farmland real estate loans and 87.60 billion dollars in production loans. These totals were 7.80 billion dollars, or 3.91 percent, higher than a year earlier. Agricultural banks accounted for $87.83 billion of agricultural loans, an increase of 3.74 percent year-over-year, while community banks held $147.23 billion, a 2.60 percent rise over the same period.
In today’s article, we examine the profitability of U.S. commercial banks engaged in agricultural lending using recent Call Report data from the Federal Deposit Insurance Corporation (FDIC). We focus on three performance ratios: (1) the yield on earning assets, (2) the cost of funding earning assets, and (3) the net interest margin. For each period, the full sample consists of commercial banks that report outstanding farm real estate or agricultural production loans. Within each period’s sample, we then identify the subset of institutions that can also be categorized as agricultural banks and another subset as community banks.[1]
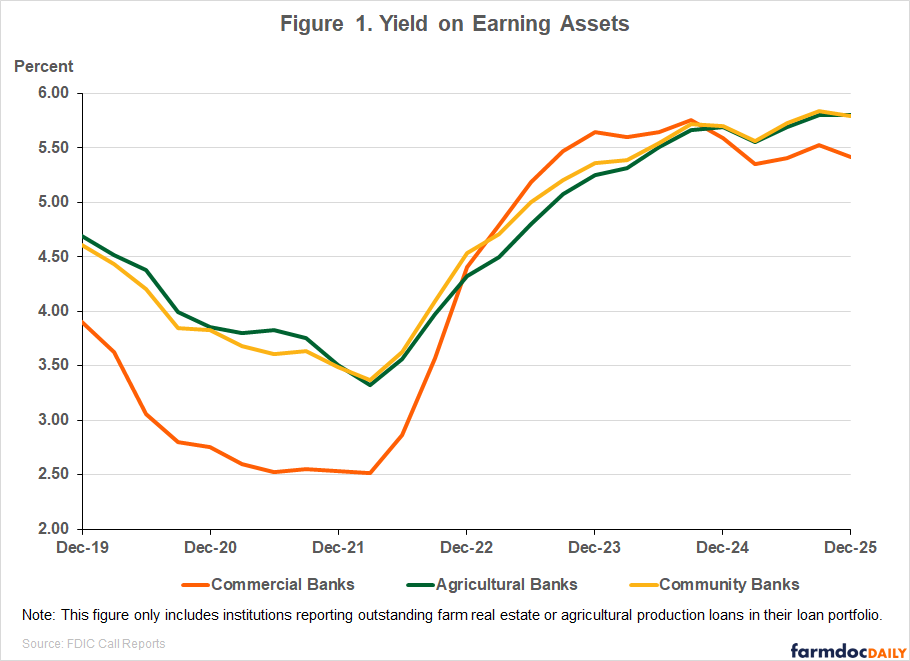
Yield on Earning Assets
In the fourth quarter, the yield on earning assets for agricultural and community banks remained above that of the full sample of commercial banks with agricultural loans, as shown in Figure 1. Yield on earning assets (YEA) measures the total interest, dividend, and fee income earned on loans, securities, and other investments as a share of average earning assets (see 2025 Quarter 4, FDIC QBP). For the full sample, YEA was 5.41 percent in the fourth quarter, which was 11 basis points lower than the previous quarter, and 18 basis points lower compared to a year ago. By comparison, agricultural banks reported a YEA of 5.80 percent, which was unchanged from the previous quarter, and 11 basis points higher than in the same period last year. Community banks also reported a YEA of 5.80 percent, which was 4 basis points lower than in the prior quarter, but 10 basis points higher than a year ago.
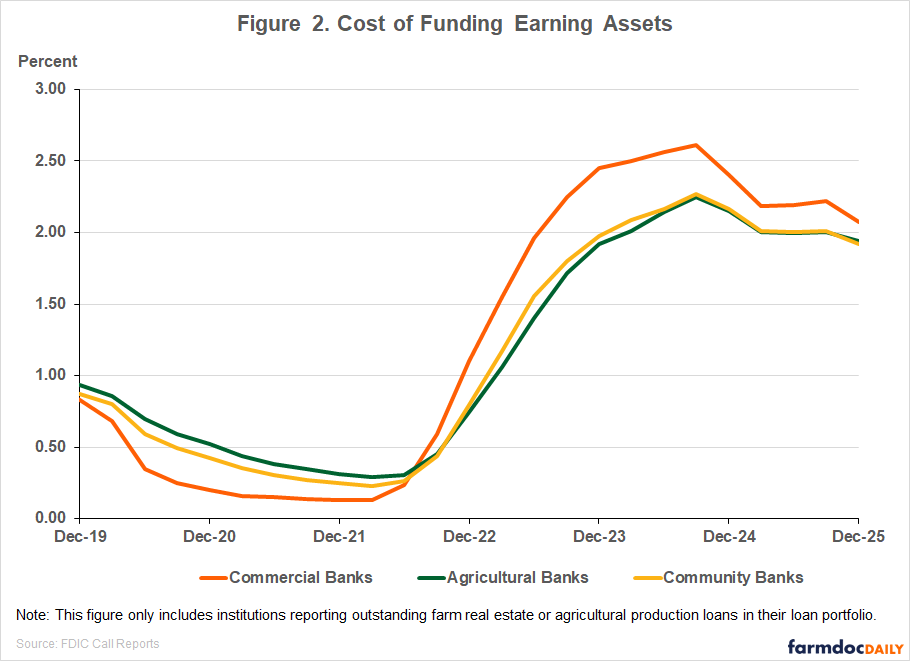
Cost of Funding Earning Assets
Cost of funding earning assets (CFEA) measures the interest expense paid on deposits and other borrowed funds as a share of average earning assets (see 2025 Quarter 4, FDIC QBP). While yields on earning assets remained above the full-sample average for both subsamples, funding costs stayed below the full-sample average in the fourth quarter, as shown in Figure 2. For all commercial banks that make agricultural loans, the CFEA was 2.07 percent, 15 basis points lower than in the prior quarter and 33 basis points lower compared to a year ago. On the other hand, agricultural banks reported a CFEA of 1.94 percent, while community banks reported 1.92 percent in the fourth quarter. Compared to a year ago, this translates to funding costs declining by 21 basis points for agricultural banks and by 24 basis points for community banks.
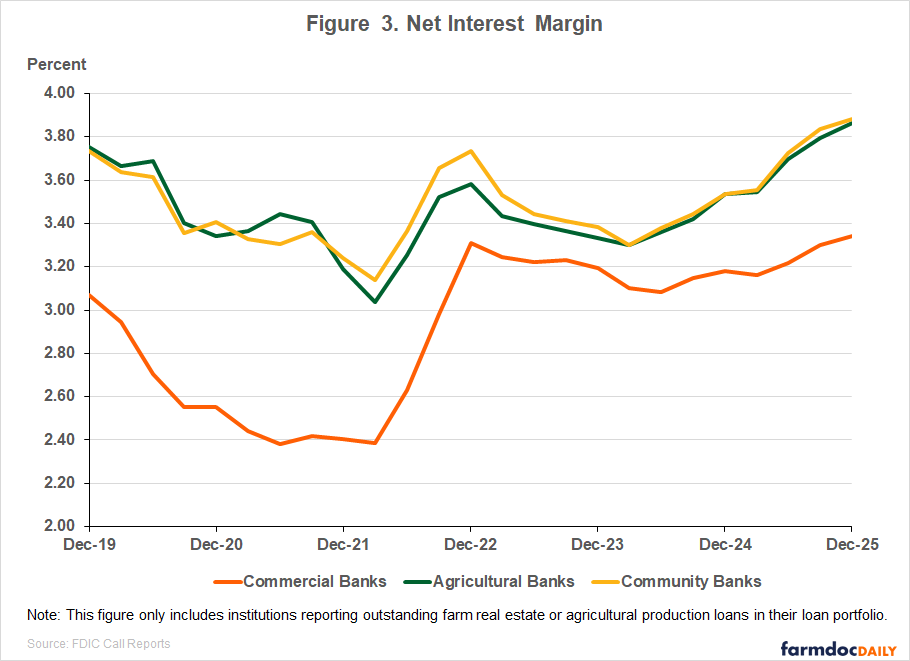
Net Interest Margin
Net interest margin (NIM) is the difference between the YEA and CFEA and measures the spread between what banks earn on their earning assets and what they pay to fund those assets (see 2025 Quarter 4, FDIC QBP). In the fourth quarter, agricultural and community banks both reported higher NIMs than the full sample, as shown in Figure 3. The NIM for commercial banks was 3.34 percent in Q4, 4 basis points higher than in the previous quarter and 16 basis points higher than a year prior. However, agricultural banks reported a higher NIM of 3.86 percent in the fourth quarter, which was an increase of 32 basis points compared to a year ago, while community banks reported a slightly higher NIM of 3.88 percent, which was 34 basis points higher over the same period.
Conclusion
Net interest margins for all commercial banks that reported agricultural loans improved in the fourth quarter of 2025, supported by lower funding costs and higher yields on earning assets. Agricultural banks and community banks that held agricultural loans on their balance sheets continued to report higher yields, lower funding costs, and wider net interest margins than the full sample of commercial banks. Year-over-year, net interest margins grew by 16 basis points for commercial banks, compared to increases of 32 and 34 basis points for agricultural and community banks, respectively.
Note
[1] We define agricultural banks as commercial banks whose combined farm real estate and operating loans account for at least 25% of their gross loans and leases.
References
Federal Deposit Insurance Corporation. (2025). Quarterly banking profile: Fourth quarter 2025 (QBP 2025 Q4). https://www.fdic.gov/quarterly-banking-profile/quarterly-banking-profile-fourth-quarter-2025.pdf
Disclaimer: We request all readers, electronic media and others follow our citation guidelines when re-posting articles from farmdoc daily. Guidelines are available here. The farmdoc daily website falls under University of Illinois copyright and intellectual property rights. For a detailed statement, please see the University of Illinois Copyright Information and Policies here.