


A Tough Nut to Crack: When Do Weekly USDA Crop Condition Reports Become Reliable for Predicting Peanut Yields?
The USDA National Agricultural Statistics Service (NASS) publishes weekly Crop Progress and Condition reports for selected crops throughout each growing season, providing stakeholders with timely information on crop health across major producing states. For corn and soybeans, the relationship between these ratings and final yields is well established, with research demonstrating that the combined percentage of the crop rated in Good or Excellent condition becomes a reliable yield predictor by mid-July for corn and mid-August for soybeans (Irwin and Good 2017b, 2017a; Li et al. 2026). Peanuts, however, are a privately traded commodity with limited published yield-forecasting research, despite being the seventh most valuable U.S. field crop (USDA NASS 1999). For peanut stakeholders, a critical question is how early these weekly USDA snapshots can reliably predict what will eventually arrive at the buy points and shellers. This work extends to peanuts the methodological framework applied to corn and soybeans by Irwin and Good (2017b) and Irwin and Hubbs (2018) and draws directly from Cunningham (2026).
Background
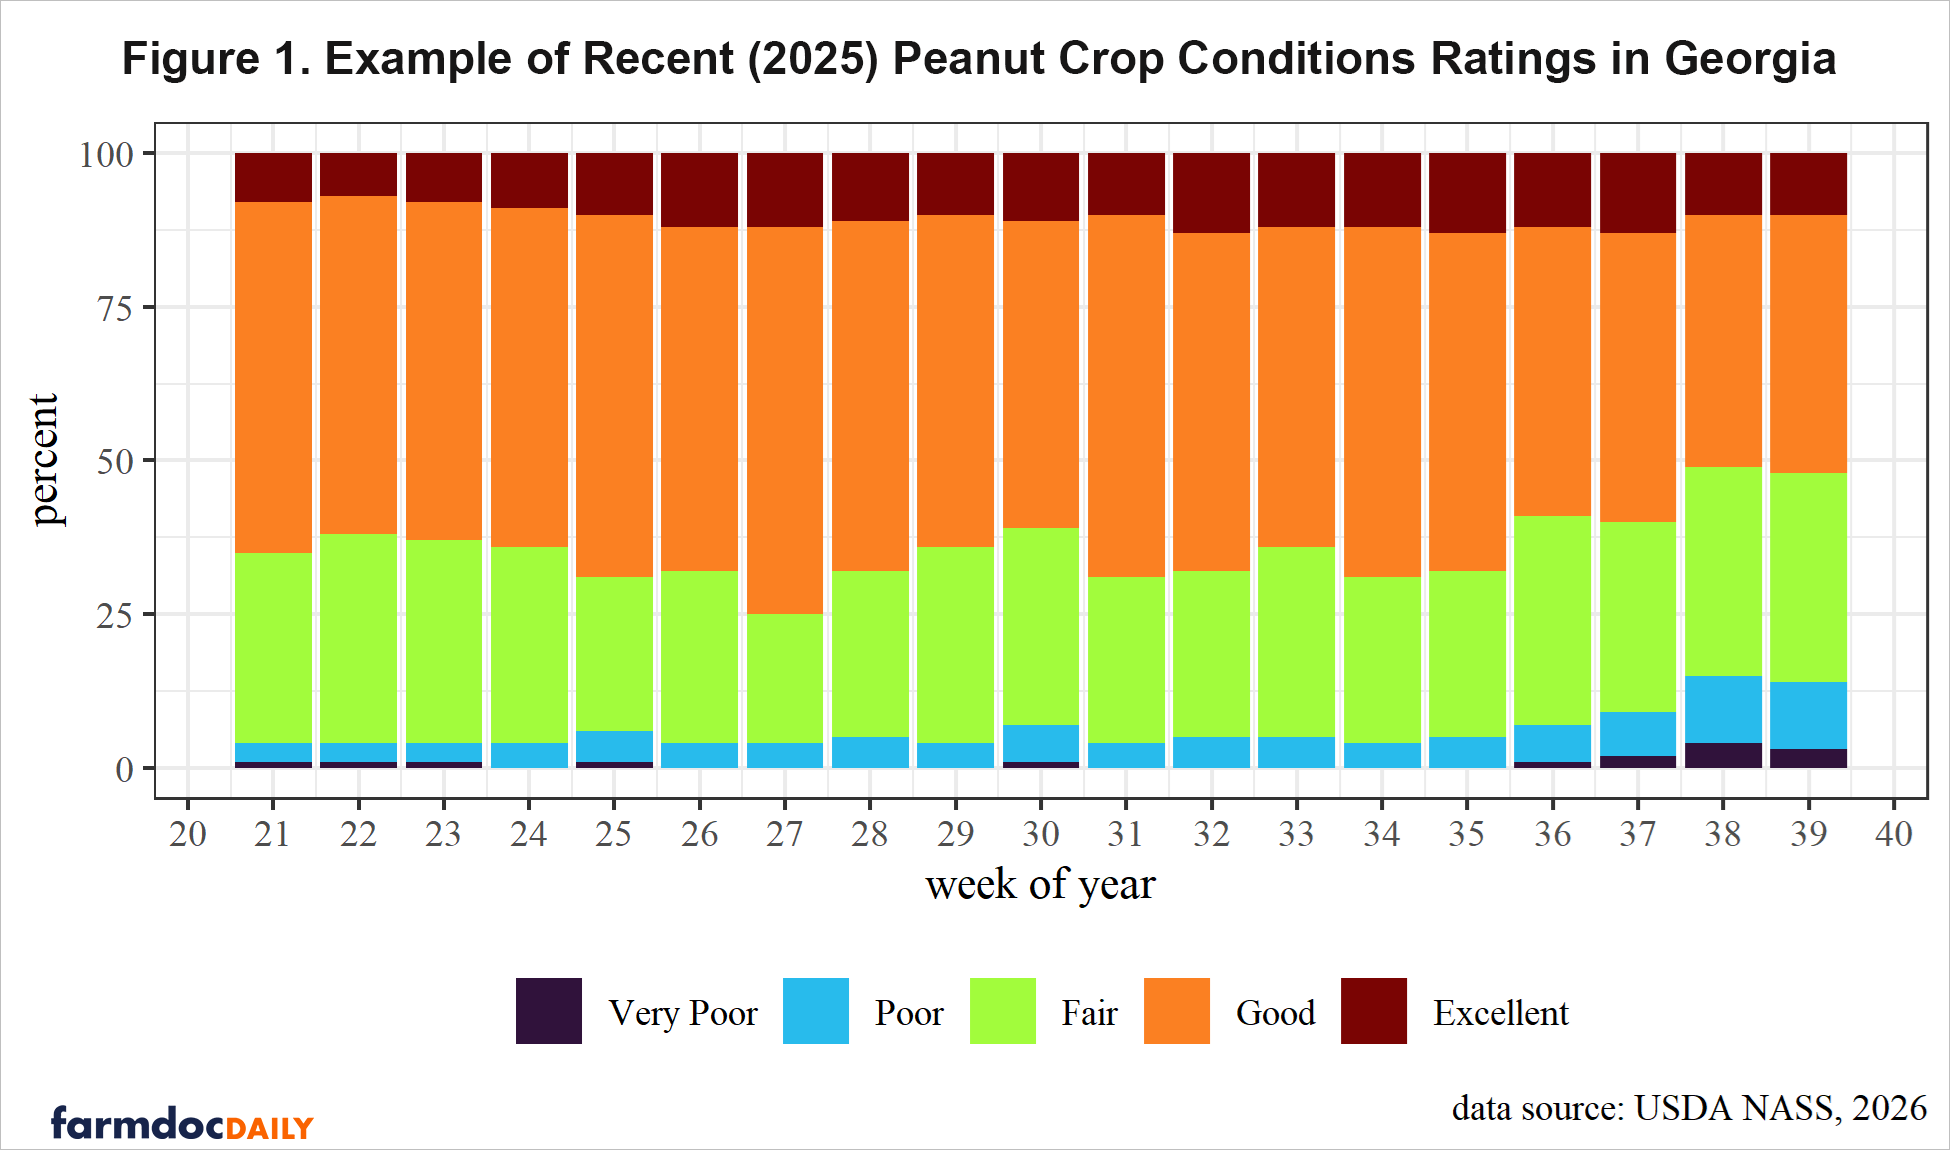
The USDA Crop Progress and Condition Report classifies the growing crop into five categories, Very Poor, Poor, Fair, Good, and Excellent, with percentages summing to 100. Reports specific to peanuts are published weekly from approximately May through October. As a recent example, Figure 1 illustrates the distribution of 2025 Georgia peanut crop condition ratings throughout the growing season.
The standard approach for converting corn and soybean condition ratings into an index for mid-season yield forecasts is the Good plus Excellent (G + E) percentage, simply the sum of the two highest condition categories (Irwin and Good 2017b; Li et al. 2026). We adopt this benchmark here. For each calendar week w and state s, the forecasting model is estimated by ordinary least squares:
![]()
where t indexes crop year, G + E are percentage of acreage rated at sum of Good and Excellent.
Analysis
Yield and crop condition data were obtained from the USDA NASS QuickStats database for the six states producing the majority of U.S. peanuts: Georgia, Alabama, Florida, North Carolina, South Carolina, and Texas (USDA NASS 2026). A test for structural breaks in long-term peanut yields identified 2012 as a natural break, coinciding with the widespread commercial adoption of the high-yielding Georgia-06G cultivar. Therefore, yield and crop condition rating observations prior to 2012 were excluded, restricting the analysis to 2013 to 2025. After this break, yield trends across the six states are approximately flat, so no trend adjustment was applied. Summary statistics for this period appear in Table 1.
|
Table 1. A Decade of Peanut Yield Production, 2013 to 2025 (pounds per acre)
|
When do crop condition ratings become informative?
Figure 2 shows the correlation between the weekly Good plus Excellent rating and two endpoints, the final Good plus Excellent rating of the season and the final observed yield, for each of the six major peanut-producing states, over the 2013–2025 period. The pattern is qualitatively consistent with what Irwin and Good (2017b) found for corn and soybeans: correlations are low and unstable early in the season, then rise as the growing season advances.
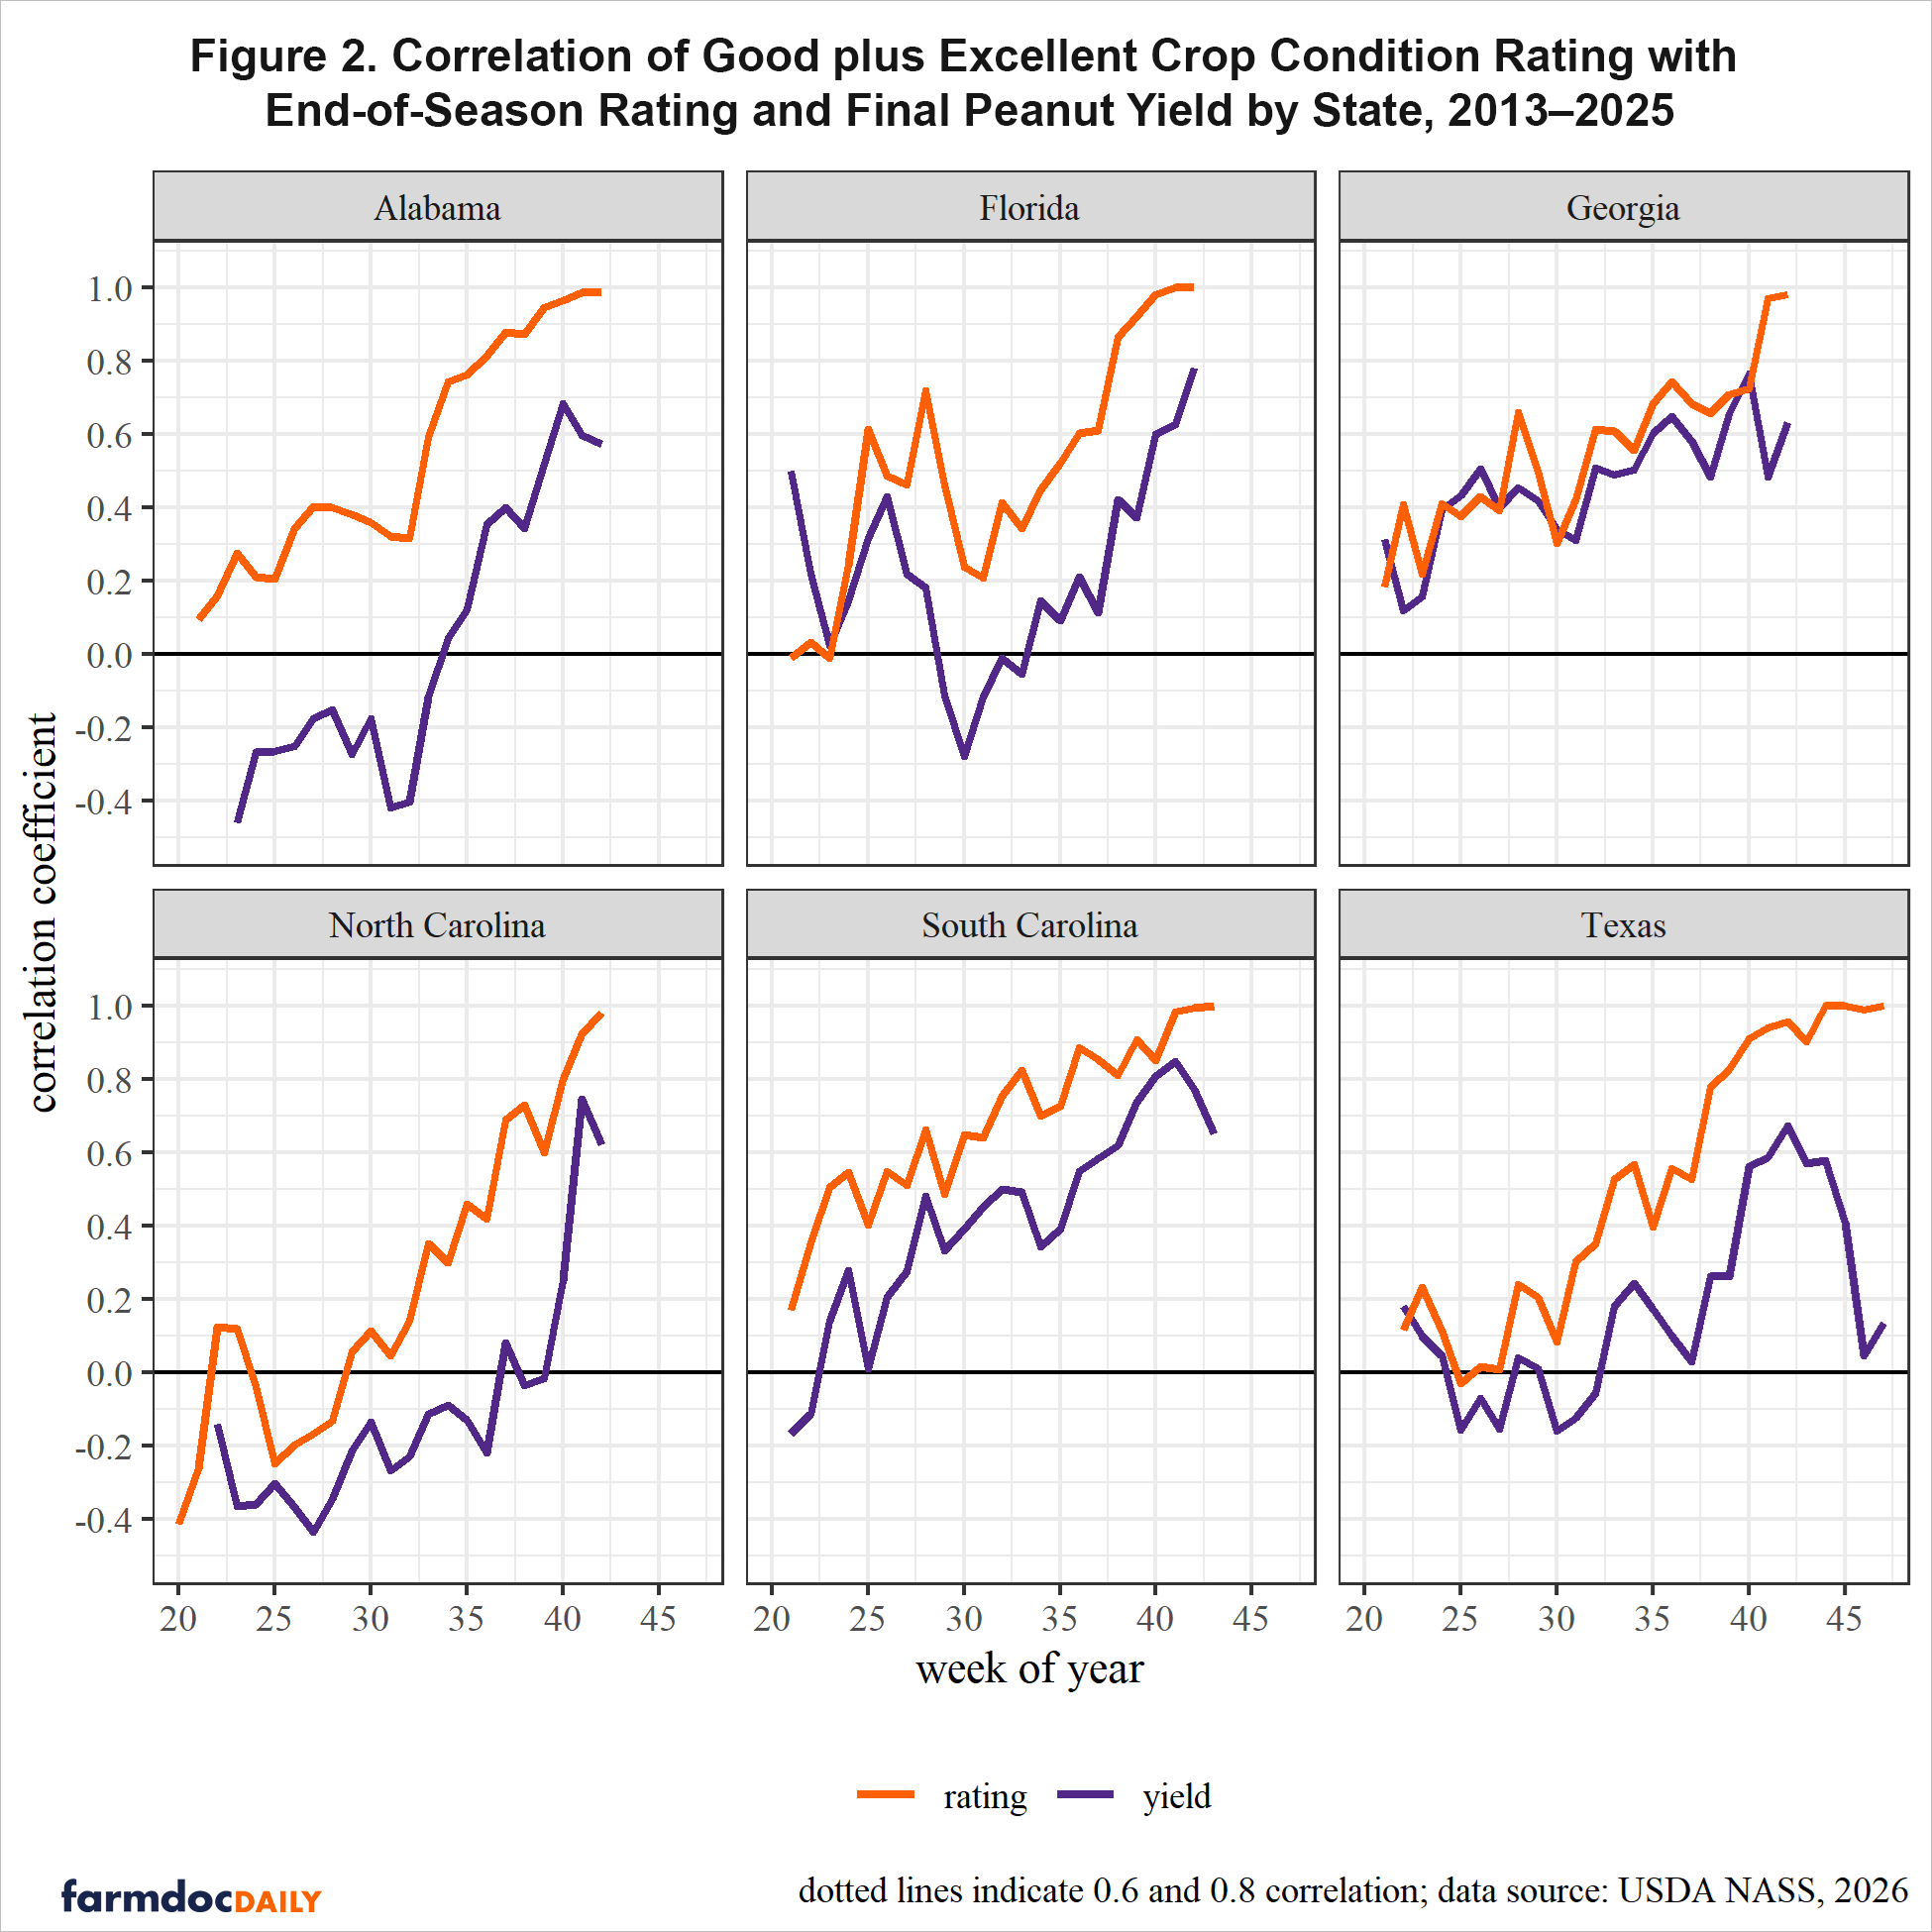
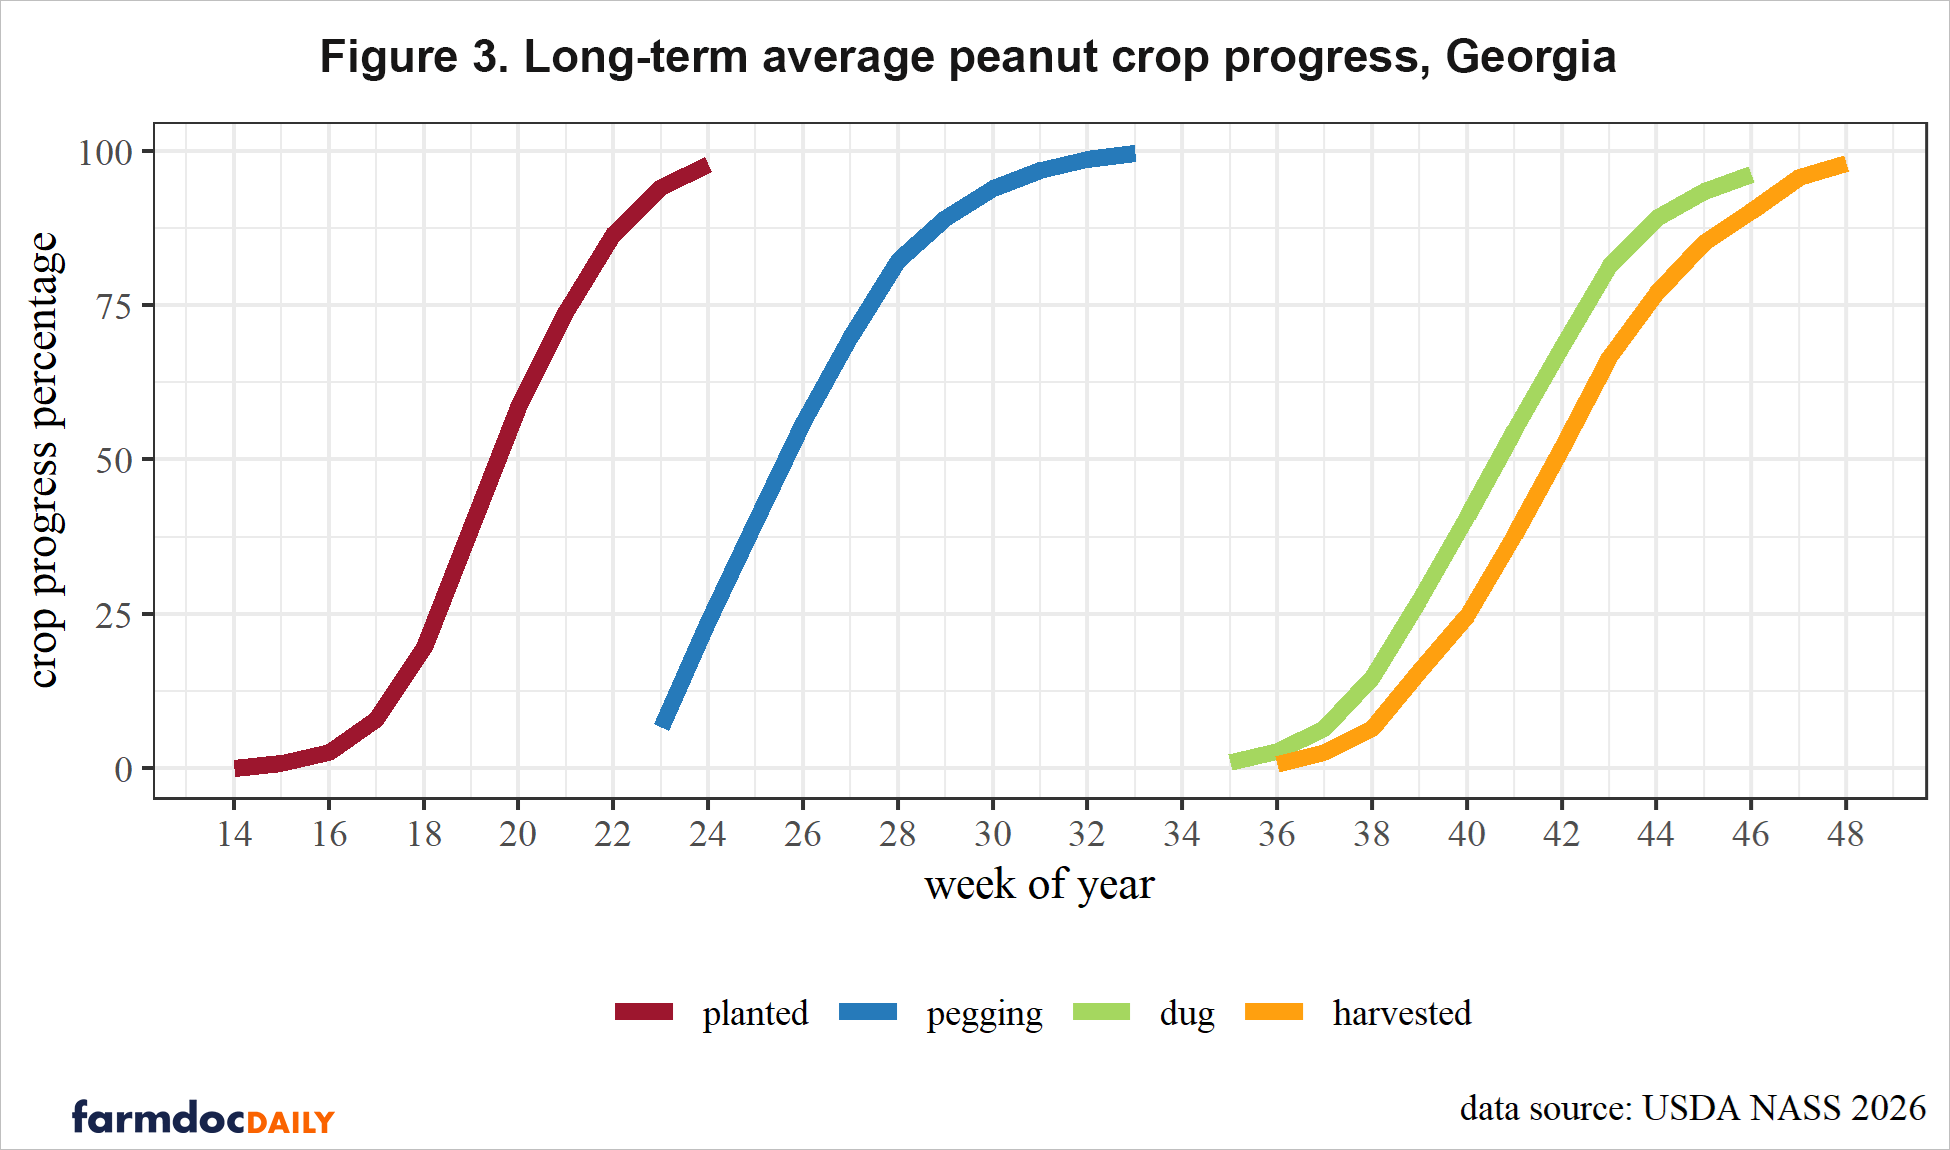
For most states, both the rating-to-final-rating and the rating-to-final-yield correlations begin to strengthen meaningfully around week 32 (early August) (Figure 3). This timing corresponds closely to the period when peanut pods begin filling, approximately 73 days after planting (DAP) for Georgia crops planted in week 20 (late May), and is broadly analogous to the corn pollination window (late June–late July) and the soybean reproductive period (late July–late August) that drive the respective timing patterns for those crops (Irwin and Good 2017b). Peanuts planted in Georgia during week 20 reach approximately 80 DAP by week 32 (early August). Pod fill, the period of seed formation referred to as pegging, begins around 73 DAP (Georgia Peanut Commission 2024). It is at this stage that realized yield potential becomes observable to field reporters, causing condition ratings to begin reflecting end-of-season outcomes rather than planting-time optimism. Unlike corn or soybeans, peanuts are harvested during a two-phase process: peanuts are first dug and inverted to sever the taproot and expose the pods for field drying, followed by mechanical harvest after the pods have sufficiently dried. This physiological and operational lag is charted in Figure 3, which reflecting the distinction of digging to final harvest.
Among the aggregation approaches evaluated in the underlying research (Cunningham 2026), the simpler G + E percentage consistently produced the lowest forecast error by week 40 (early October), outperforming more complex weighted indices, a result consistent with Li et al. (2026) for corn and soybeans. The analysis reported here therefore focuses exclusively on the G + E scheme.
How accurate are in-season forecasts?
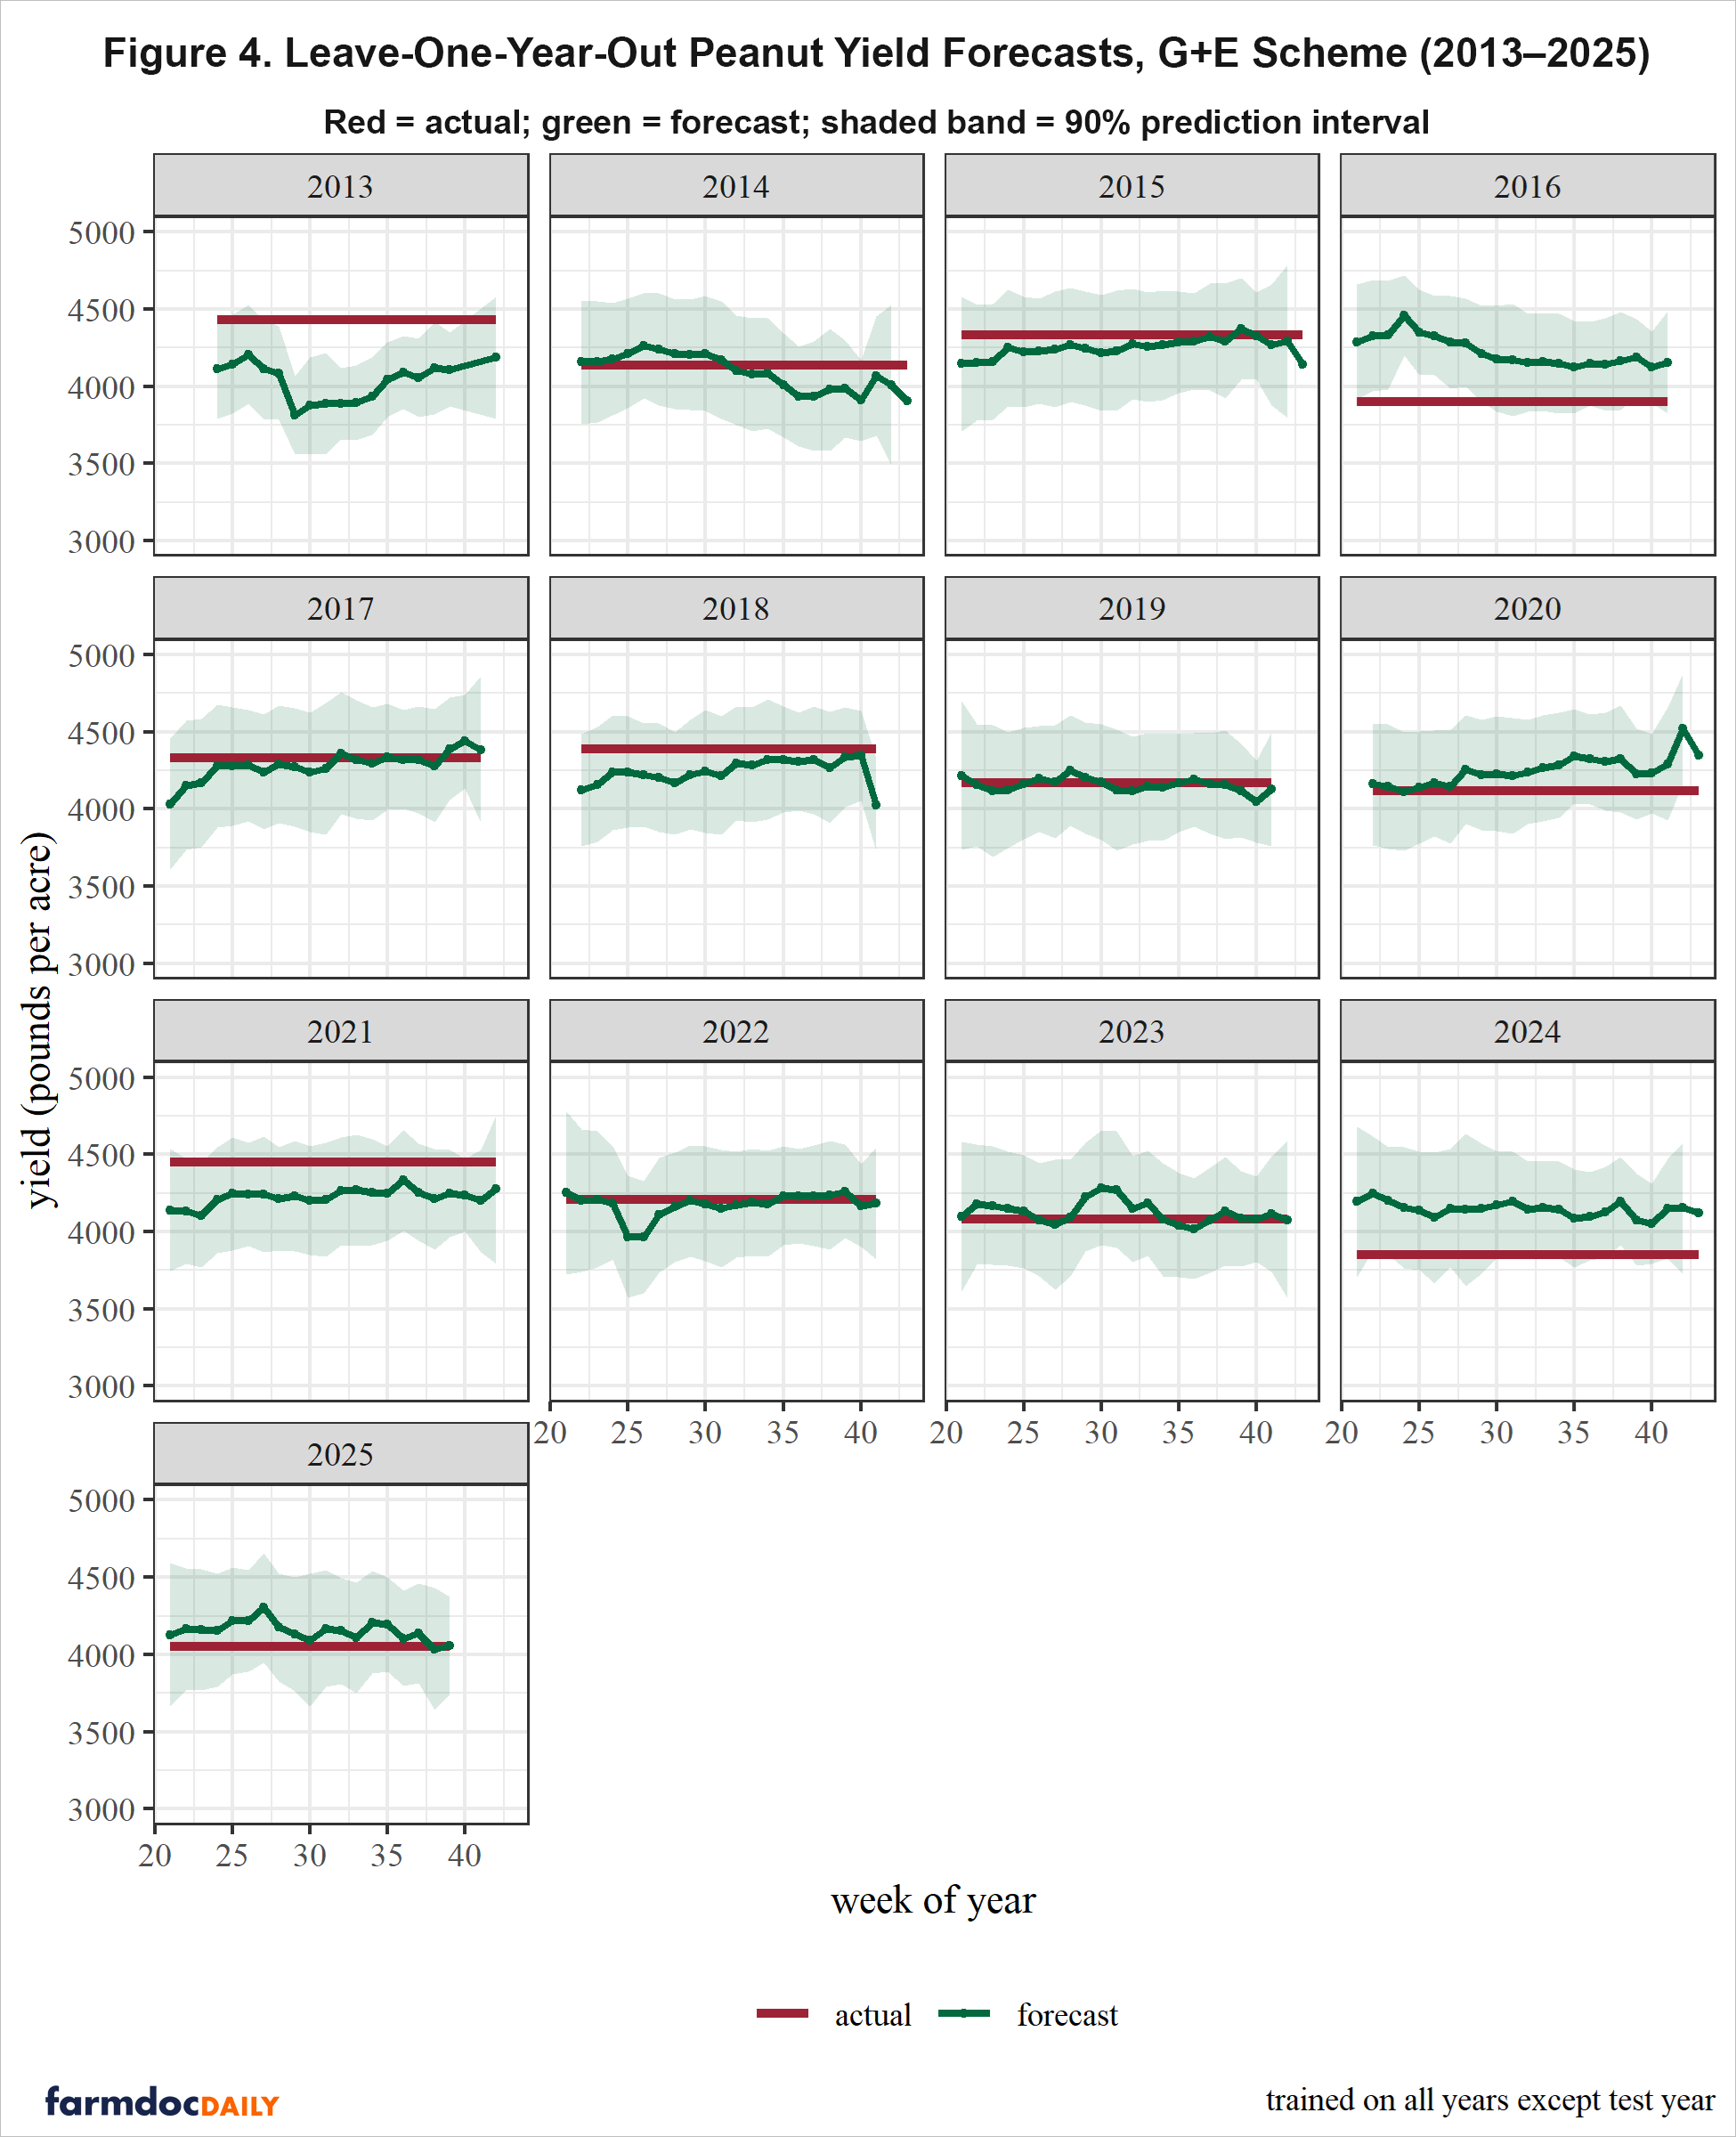
Figure 4 shows the leave-one-year-out (LOYO) yield forecasts for each crop year in the sample under the G + E scheme. The green line is the weekly forecast; the red line is the realized yield; the shaded band is the 90% confidence interval. Forecast accuracy improves as the season advances, with predicted yields converging toward realized outcomes by weeks 38 to 42. The G + E model performs best in typical years such as 2019, 2022, and 2023, where final forecasts are relatively close to observed yield. Performance deteriorates in atypical years, 2013, when yields were unusually high, and 2016 and 2024, when late-season weather reduced yields below what condition ratings implied. In 2024, excessive spring rainfall followed by summer drought and harvest-time precipitation combined to produce conditions poorly represented by the rating-based model. The remaining years (2014, 2015, 2017, 2018, 2021, and 2025) were considered normal. This interannual variation is consistent with findings from corn and soybean forecasting, where Irwin and Hubbs (2018) documented forecast errors of ±9.3 bu/acre at Week 25 for corn.
Implications
A widely used method for forecasting corn and soybean yields is based on the relationship between end-of-season Good plus Excellent crop condition ratings and final yield, with within-season ratings plugged into the model as they become available. This article extends that framework to peanuts using state-level USDA NASS data for 2013–2025.
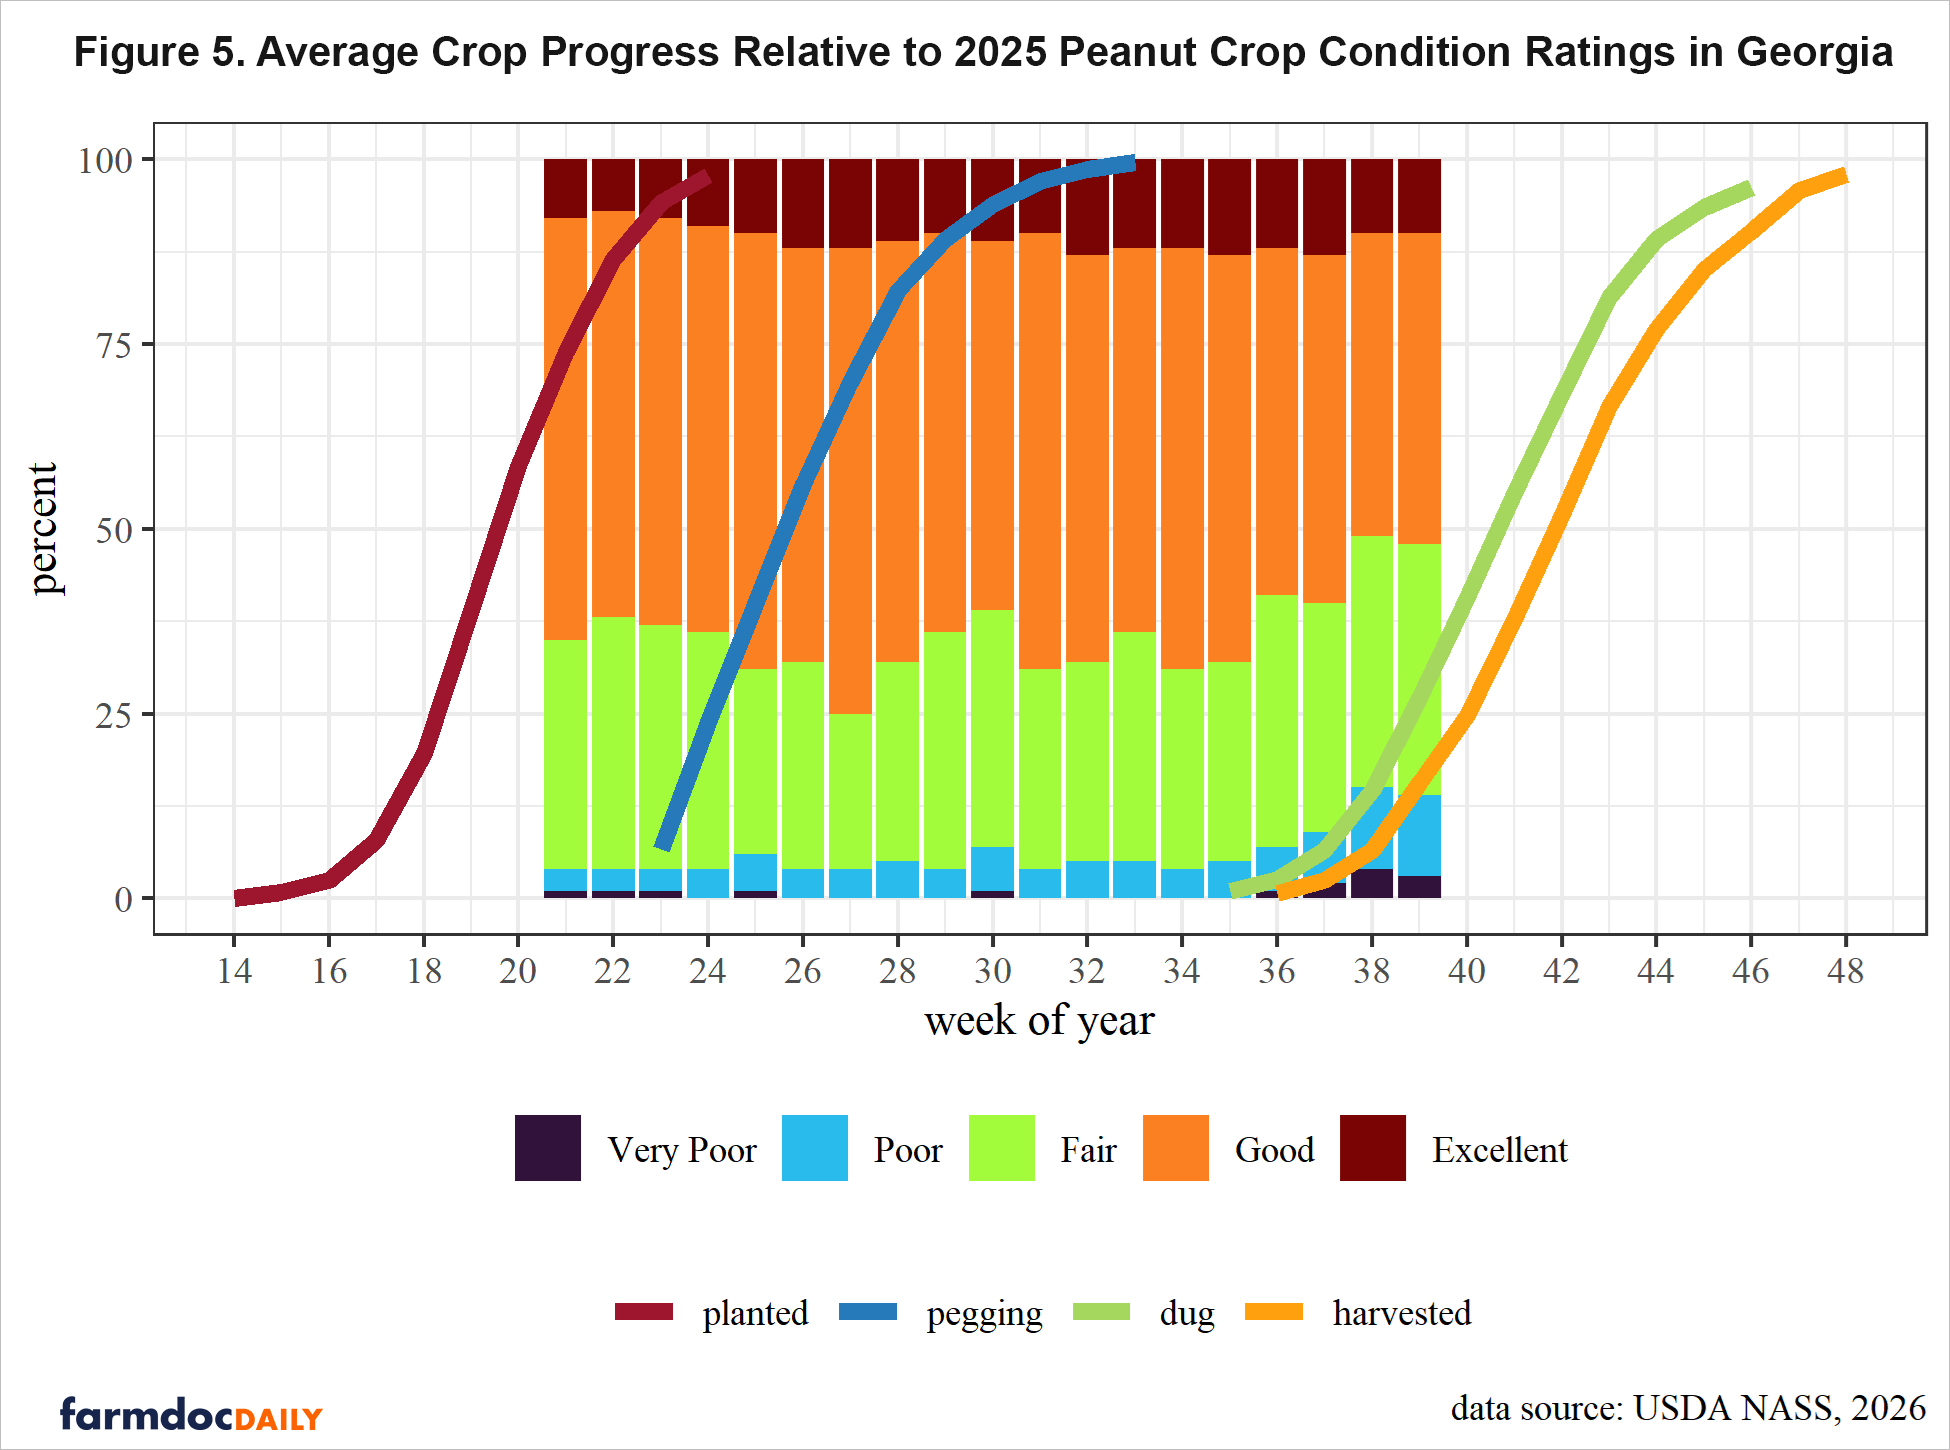
Superimposing the crop progress percentages from Figure 3 on top of the 2025 crop condition ratings for Georgia (Figure 1) visually reinforces when ratings become useful for end-of-season yield forecasts relative to physiological development in Figure 5. Our analysis indicates that the simpler Good plus Excellent index, the same metric readily available in the weekly USDA Crop Progress report, provides little useful information for final peanut yield during the early portion of the growing season. Correlations begin to strengthen around week 32 (early August), coinciding with the onset of pod fill (Figure 5), the physiologically critical period for yield determination. By week 40 (early October), when much of the crop is approaching or at harvest, forecasts based on the G + E index achieve operationally useful precision for processors, shellers, and marketing teams.
The finding that the simpler candidate scheme, G + E, outperforms more elaborate weighting approaches replicates for peanuts what Li et al. (2026) found for corn and soybeans: added index complexity does not improve, and can slightly worsen, out-of-sample forecast accuracy. An additional consideration for peanut market participants is the absence of an exchange-traded futures contract analogous to the CBOT corn and soybean contracts. Unlike corn or soybeans, peanuts lack a ‘price discovery’ mechanism through a liquid futures market. This leaves a void that analyses of the USDA Crop Progress reports may be able to fill. When that Week 32 report drops, it is not simply a weather update, it is often the first mid-season signal that shellers and growers receive to anchor their harvest-time price expectations. Without a futures market, USDA crop condition ratings serve an even more prominent price-discovery role for peanuts than for row crops. Shellers and buying points rely heavily on these publicly available signals to form expectations about crop size and negotiate forward contract terms with producers before harvest. Growers similarly use them to judge whether to contract remaining unpriced tonnage or hold for spot prices. The G + E rating released around week 32, the first operationally reliable signal, therefore carries outsized market significance in the peanut supply chain relative to what an equivalent corn or soybean rating would convey.
Several caveats apply. With only 13 post-break years of data, parameter estimates carry more uncertainty than the 30+ year corn and soybean analyses. Forecasts in years with unusual weather sequences or disease pressure can exhibit persistent bias of 5 to 10%. The analysis covers yield but not quality, which also matters for peanut marketing. Future work should examine whether supplemental variables, rainfall indices, temperature accumulations, or pest pressure indicators, reduce forecast error in atypical seasons.
References
Cunningham, Taylor Mock. 2026. “Forecasting End-of-Season Peanut Yield Using Mid-Season Crop Condition Rating Signals.” Master of Agribusiness thesis, Kansas State University. https://hdl.handle.net/2097/47126.
Georgia Peanut Commission. 2024. The Life Cycle of a Peanut: From Planting to Harvest. https://gapeanuts.com/peanutlifecycle/.
Irwin, Scott, and Darrel Good. 2017a. “How Should We Use Within-Season Crop Condition Ratings for Corn and Soybeans?” farmdoc Daily 7 (101). https://farmdocdaily.illinois.edu/2017/06/how-to-use-within-season-crop-condition-ratings.html.
Irwin, Scott, and Darrel Good. 2017b. “When Should We Start Paying Attention to Crop Condition Ratings for Corn and Soybeans?” farmdoc Daily 7 (96). https://farmdocdaily.illinois.edu/2017/05/when-start-paying-attention-crop-condition-ratings.html.
Irwin, Scott, and Todd Hubbs. 2018. “Measuring the Accuracy of Forecasting Corn and Soybean Yield with Good and Excellent Crop Condition Ratings.” farmdoc Daily 8 (118). https://farmdocdaily.illinois.edu/2018/06/measuring-the-accuracy-of-forecasting-corn-and-soybean-yield.html.
Li, Jiarui, Scott H. Irwin, and Todd Hubbs. 2026. “Does Complexity Pay? Forecasting Corn and Soybean Yields Using Crop Condition Ratings.” Journal of Agricultural and Resource Economics 51 (1): 32–52. https://doi.org/10.22004/ag.econ.358998.
USDA NASS. 1999. Understanding USDA Crop Forecasts. Miscellaneous Publication No. 1554. United States Department of Agriculture, National Agricultural Statistics Service and World Agricultural Outlook Board. https://www.nass.usda.gov/Education_and_Outreach/Understanding_Statistics/pub1554.pdf.
USDA NASS. 2026. “USDA National Agricultural Statistics Service QuickStats Database.” United States Department of Agriculture, National Agricultural Statistics Service. https://quickstats.nass.usda.gov/.
Disclaimer: We request all readers, electronic media and others follow our citation guidelines when re-posting articles from farmdoc daily. Guidelines are available here. The farmdoc daily website falls under University of Illinois copyright and intellectual property rights. For a detailed statement, please see the University of Illinois Copyright Information and Policies here.