


New-Crop Soybean Oil Export Projection Suggests Greater Price Volatility
The USDA recently released its first official World Agricultural Supply and Demand Estimates (WASDE) for the 2026/27 soybean marketing year on May 12. The report was neutral to slightly bullish for the soybean market. Projected 2026/27 US ending stocks for soybeans were 310 million bushels, or 40 million bushels below analysts’ pre-report estimates, mainly due to increases in projected domestic US soybean crushing outpacing declines in projected soybean exports. The new-crop November 2026 futures price gaining roughly 10 cents per bushel or 2.3% on the day of the report release.
These relatively modest changes in the soybean market quantities and prices obscure a larger structural change in the composition of soybean demand. This shift was revealed more clearly in the US soybean oil balance sheet projections also released in the May WASDE. USDA projected US soybean oil exports for 2026/27 at just 400 million pounds, the second lowest quantity on record since at least the 1964/65 marketing year. Despite crushing more soybeans in the US than ever, the resulting soybean oil will almost entirely be consumed domestically with biomass-based diesel production making up the largest share of use.
Rising demand for soybean oil as a biofuels feedstock is not news to anyone involved in the soybean market. However, the implications of this change for soybean price dynamics going forward remain subject to debate. As a general rule, agricultural commodity export demand is thought to be more price-responsive (or ‘elastic’) than US domestic demand. When production fluctuates, export markets often make the largest adjustments, buffering the price impacts of supply shocks both to the upside and downside. Driving soybean oil exports to near-zero and consuming that oil in the US implies a less elastic demand base and larger price changes in response to shifts in US soybean supply. Price volatility will be greater, especially if policy and other mechanisms cut ties between the US soybean oil market and global vegetable oil markets.
Soybean Balance Sheet Projections
New-crop 2026/27 marketing year US soybean supply and demand estimates are shown in Table 1. For context, data for the two previous marketing years are also shown along with the preliminary 2026/27 balance sheet that USDA presented at its Agricultural Outlook Forum in February. Relative to the February numbers, the May WASDE new-crop balance sheet contains planted acreage estimates released by USDA at the end of March and updated old-crop usage estimates that have lowered 2025/26 carry out estimates slightly. The supply side of the balance sheet contained no surprises; yield is pegged at long-run trend level which coincidentally results in no change in 2026 from the 2025 number and total supply of 4.8 billion bushels is very similar to the estimated level from February.
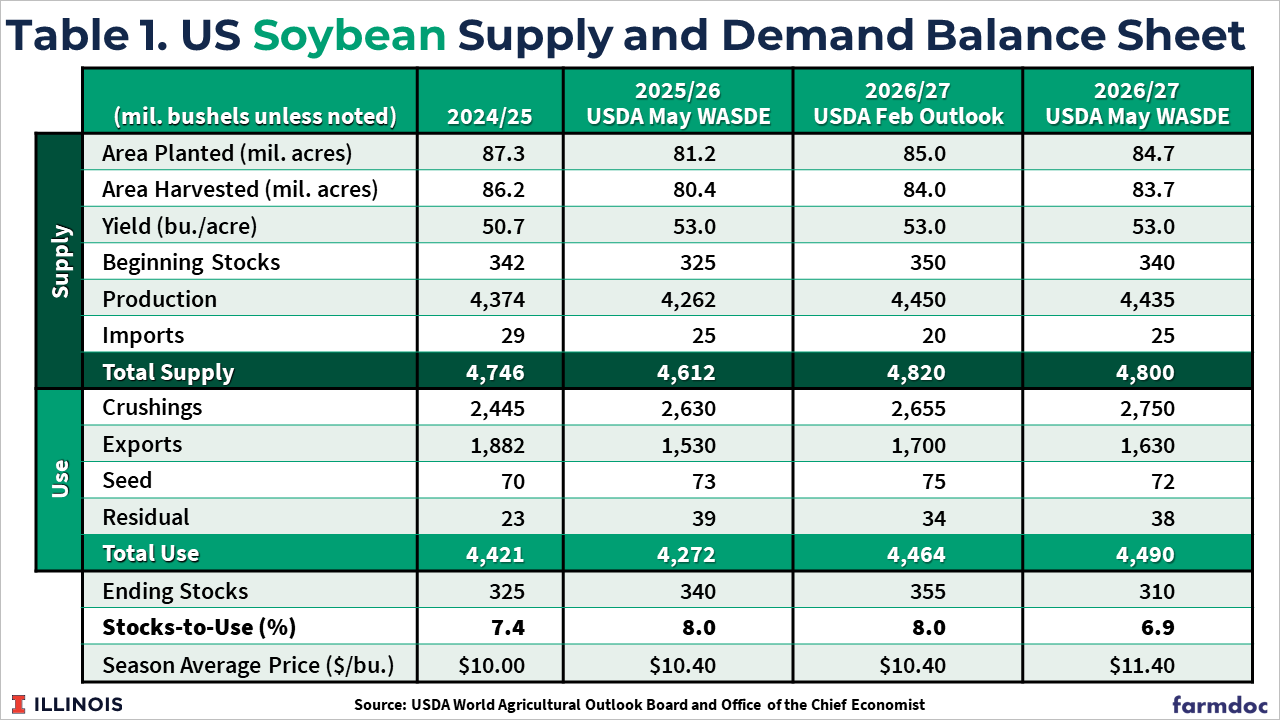
Changes in projected 2026/27 US soybean use are greater than updates to supply. Domestic crushings continue to grow with the latest estimate 95 million bushels higher than the February Outlook figure and 305 million bushels or 12% above the level from just two years ago. However, soybean oilseed exports at 1.63 billion bushels, are down sharply from the February estimate and just slightly higher than the dismal total estimated for the current marketing year. The fall in exports offset much of the higher forecast for domestic crush, so the overall balance sheet remains adequately supplied especially in light of the relatively well-supplied global soybean market. The US stocks-to-use ratio is pegged at 6.9%, slightly lower but still near levels for the past two marketing years.
The 2.75 billion bushels of soybeans projected to be processed in the US next marketing year are estimated to produce 32,590 million pounds of soybean oil, an increase of more than 35% since 2020/21. Rapid growth in this period is attributed to growth in US soybean crush capacity in response to the renewable diesel boom (see Gerveni, Hubbs, and Irwin, 2024). The oil extraction rate implied by USDA estimated soybean oil production is 19.75%, slightly lower than the historically high elevated levels observed in recent years when soybean processors managed to squeeze more oil out of US soybeans (see Janzen, Irwin, and Wang, 2025).
Near-Zero Soybean Oil Exports
Higher US soybean oil production is mainly expected to be used as an input in biomass-based diesel fuel production, especially as the transportation fuels industry seeks to comply with elevated blending obligations under the renewable fuels standard (see Hubbs and Irwin, 2026a, 2026b). Higher domestic use is expected to drive US soybean oil exports to a near-zero level. (In practice, aggregate trade quantities for major agricultural commodities rarely are exactly zero because some trade is viable in specific circumstances or geographies.)
Figure 1 shows the latest 2026/27 initial WASDE number for US soybean oil exports is 400 million pounds. This is the lowest initial projection on record and if realized would be the second lowest final estimate since 1964/65 when data first became available, behind only the 377 million pounds exported in 2022/23 in initial stages of the renewable diesel boom.
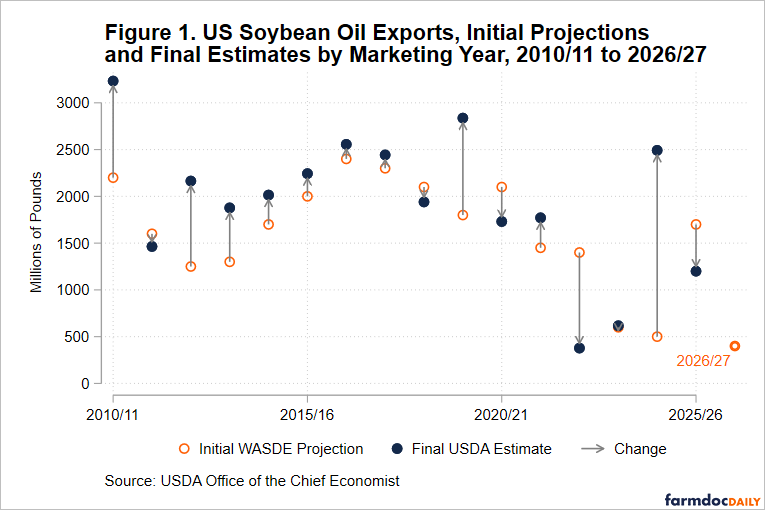
Figure 1 shows US soybean oil export projections have changed both across and within marketing years. Exports can rise above initial projections, as in years like 2019/20 when weaker demand for soybean oilseed exports led to greater domestic crush as a trade mitigation strategy. Projections can also fall as in 2022/23 due to biofuels feedstock demand.
Implications
What we have not seen in the historical record on US soybean oil exports is what happens when initial export projections are very low (as projected for 2026/27) and soybean availability becomes more limited. In that case, balance sheet changes cannot be buffered by relatively elastic export demand. This mechanism for adjustment has been exhausted. Imports could be part of the market’s response to such change but US policy places restrictions on imported feedstocks and thus limits the value of imported soybean oil (see Hubbs and Irwin, 2026c). If the US soybean oil market is disconnected from other global vegetable oil markets, then domestic prices become the main margin along which the market can adjust to forthcoming supply shocks. Diminished elasticity means more price volatility, so market participants should likely anticipate greater swings in soybean oil prices this year and next relative to historical conditions. Volatility is a double-edged sword for producers and end-users who have directional exposure to soybean prices, as it implies both price increases and decreases will be larger.
References
Gerveni, M., T. Hubbs and S. Irwin. "FAME Biodiesel, Renewable Diesel, and Biomass-Based Diesel Feedstock Trends over 2011-2023." farmdoc daily (14):71, Department of Agricultural and Consumer Economics, University of Illinois at Urbana-Champaign, April 12, 2024.
Hubbs, T. and S. Irwin. "Rewriting the RFS Playbook: The Impact of No Half-RIN and Higher RVOs on Projected Biomass-Based Diesel Production and Feedstock Use for 2026-2027." farmdoc daily (16):31, Department of Agricultural and Consumer Economics, University of Illinois at Urbana-Champaign, February 25, 2026.
Hubbs, T. and S. Irwin. "Rewriting the RFS Playbook: Final 2026-2027 RVOs for Biomass-Based Diesel." farmdoc daily (16):66, Department of Agricultural and Consumer Economics, University of Illinois at Urbana-Champaign, April 16, 2026.
Hubbs, T. and S. Irwin. "Rewriting the RFS Playbook: The Impact of Final RVOs on Projected D4 Biomass-Based Diesel RIN Generation for 2026-2027." farmdoc daily (16):73, Department of Agricultural and Consumer Economics, University of Illinois at Urbana-Champaign, April 27, 2026.
Janzen, J., S. Irwin and Y. Wang. "The Soybean Industry Response to the Renewable Diesel Boom, Part 2: Squeezing More Oil from the Soybean Crush." farmdoc daily (15):165, Department of Agricultural and Consumer Economics, University of Illinois at Urbana-Champaign, September 10, 2025.
Disclaimer: We request all readers, electronic media and others follow our citation guidelines when re-posting articles from farmdoc daily. Guidelines are available here. The farmdoc daily website falls under University of Illinois copyright and intellectual property rights. For a detailed statement, please see the University of Illinois Copyright Information and Policies here.