


The Evolving US Southern Crop Problem
Southern crop agriculture occupies a prominent position in the history of the US crop safety net (Coppess). Understanding its role in US crop agriculture is thus important. Over the last 100 years, harvested crop acres have declined more in the US South than rest of the US. Cotton accounted for most the decline in the first 50 years. Over the last 50 years, however, harvested acres have declined much more for crops other than the commodity program crops associated with the US South (cotton, peanuts, rice). The change in acreage dynamics prompts a rarely asked question, “Has the high support for cotton, peanuts, and rice hurt Southern crop agriculture in total?”
South vs. Rest of US
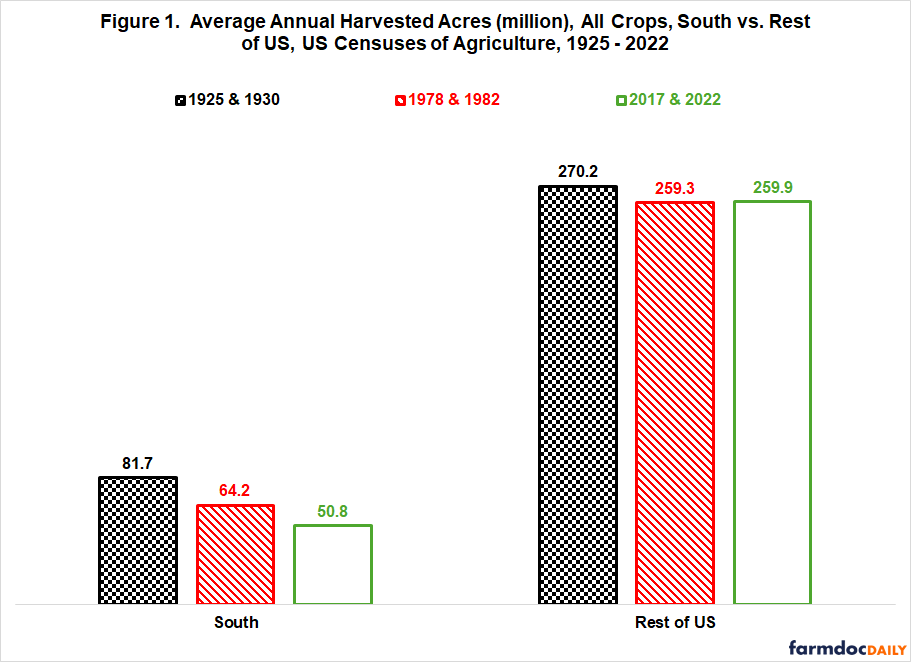
The ultimate indicator of competitiveness in crop agriculture is the change in planted acres. The most competitive crops and areas gain acres. The least competitive lose acres. Over the last 100 years, harvested acres of all crops in the US South have declined by 31.9 million (38%) and by 10.3 million acres (4%) in the rest of the US (see Figure 1). This comparison is consistent with crop agriculture in the US South being less competitive than the rest of the US. Moreover, since the crop prosperity of the 1970s, or roughly the last 50 years, harvested acres of all crops have continued to decline in the US South but changed little for the rest of the US (see Data Note 1). The US South is defined in this article as the states of Alabama, Arkansas, Florida, Georgia, Louisiana, Mississippi, North Carolina, South Carolina, Tennessee, Texas, and Virginia.
Cotton, Peanuts, Rice
Cotton, peanuts, and rice are US commodity program crops traditionally associated with the US South. Over the years, they have received higher government support per acre than most other program crops (see, for example, farmdoc daily of June 17, 2020). However, changes in their acres present a mixed picture. During the last 100 years, acres of cotton harvested in the US South have declined by 82% or over 30 million acres while acres of peanuts and rice have increased (see Figure 2). Since 1980, only acres of peanuts have increased. The acres in Figure 2 are from QuickStats (US Department of Agriculture, National Agricultural Statistics Service). QuickStats was used because the 1925 and 1930 US Censuses of Agriculture did not report data by state for some of these crops.
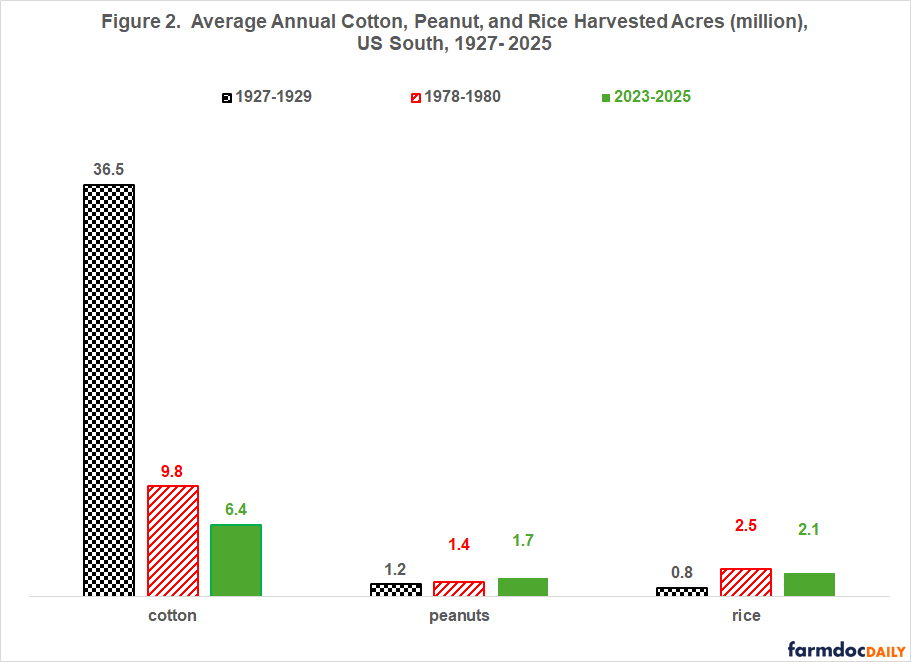
Although different data sources and slightly different periods are used, comparing Figures 1 and 2 reveals that, from the perspective of the last 100 years, the decline in cotton harvested acres nearly equals the decline in all US South harvested acres [-30.1 million for cotton (Figure 2) vs. -30.9 million for all US South crops (Figure 1)]. However, since 1980, or roughly the last 50 years, harvested acres of all crops in the US South have declined by 13.4 million, much greater than the 3.4 million decline in cotton harvested acres and the combined 3.1 million decline in cotton-peanut-rice harvested acres.
Discussion
Over the last 100 years, crop acres have declined relatively much more in the US South than has the rest of the US, a pattern that continues today.
The disproportionate loss of cropland can be viewed as a potential rationale for the disproportionately higher farm safety net support provided to cotton, peanuts, and rice, thus assisting a region whose agriculture is less competitive than the rest of the US.
Since 1980, acres of all other crops in the US South have declined much more than have cotton-peanut-rice acres, which is consistent with their higher levels of government support.
While the US South crop sector may be in worse economic shape without the disproportionate support for cotton-peanuts-rice, the preceding points also prompt this rarely asked question, “Has the disproportionate support for cotton-peanuts-rice ended up hurting US Southern Agriculture in total?”, in part by inhibiting diversification and innovation in other crops.
The associated policy question is, “Would the US South benefit from a crop safety net rebalanced to be more similar across crops?”
More boldly, if the US wishes to continue to provide more assistance to Southern crop agriculture than to US crop agriculture, “Should it be as a Federal-state matching program open to all US South crops?”
References
Coppess, J. 2018. The Fault Lines of Farm Policy: A Legislative and Political History of the Farm Bill. University of Nebraska Press: Lincoln and London.
US Department of Agriculture, National Agricultural Statistics Service. May 2026. Census of Agriculture, various years, 1925 through 2022. www.agcensus.usda.gov
US Department of Agriculture, National Agricultural Statistics Service. May 2025. QuickStats. https://quickstats.nass.usda.gov/
Zulauf, C., G. Schnitkey, J. Coppess, N. Paulson and K. Swanson. "ARC-CO and PLC Payment per Base Acre – 2014 Farm Bill." farmdoc daily (10):110, Department of Agricultural and Consumer Economics, University of Illinois at Urbana-Champaign, June 17, 2020.
Disclaimer: We request all readers, electronic media and others follow our citation guidelines when re-posting articles from farmdoc daily. Guidelines are available here. The farmdoc daily website falls under University of Illinois copyright and intellectual property rights. For a detailed statement, please see the University of Illinois Copyright Information and Policies here.