


2025 RMA County Yields and ECO/SCO Payments
The Risk Management Agency (RMA) of the USDA has released their final county yields estimates for 2025, providing information needed to calculate payments from area yield insurance plans including the Enhanced and Supplemental Coverage Options (ECO and SCO). Yield losses were sufficient in many areas to trigger ECO or SCO payments on corn, soybean, and wheat acres. Since the harvest prices for all three crops was below the projected insurance price in 2025, an even larger number of counties experienced revenue losses sufficient to trigger ECO and SCO payments.
ECO and SCO Background
ECO and SCO are supplemental area-based insurance programs that can be added as additional endorsements to a producer’s underlying individual insurance coverage. They can be combined with Yield Protection (YP) to provide additional area-based yield coverage, or combined with Revenue Protection or Revenue Protection with the Harvest Price Exclusion (RP or RP-HPE) to provide additional area-based revenue coverage.
For the 2025 crop year, ECO had two coverage level options – 95% or 90% – with a coverage band that extends down to 86%. SCO covers from 86% down to the coverage level of the underlying individual plan selected by the producer.
When combined with YP, ECO and SCO provide area yield insurance. ECO-95 will trigger payments when the actual county yield estimate is less than 95% of RMA’s expected yield, or when a yield loss of at least 5% is experienced relative to the insured’s expected yield. ECO-90 triggers at a 10% yield loss. SCO begins triggering when yield falls below 86% of RMA’s expected yield, requiring 14% yield loss.
When combined with an underlying revenue plan such as RP, ECO and RP act as revenue policies. ECO-95 requires a 5% revenue loss and ECO-90 requires a 10% yield loss. SCO requires a 14% revenue loss to trigger. More detailed discussion of ECO and SCO has been provided in other farmdoc daily articles (see, as examples, articles from February 27, 2014, November 24, 2020, February 11, 2025 and February 24, 2026).
The sections below illustrate the areas where ECO and SCO payments were triggered for 2025 based on the county yield estimates recently released by RMA for non-irrigated corn, soybeans, and wheat. Two maps are provided for each crop – the upper panel shows yield losses relative to the county’s expected yield on a percentage basis while the lower panel shows revenue losses. For the top panel, yield losses are shown for the following categories:
- No yield loss – actual yield was at or above expected yield.
- Yield loss less than 5%. ECO and SCO combined with YP will not trigger.
- Yield loss between 5% and 10%. ECO-95 will trigger when combined with YP.
- Yield loss between 10 and 14%. ECO-95 and ECO-90 will trigger when combined with YP. SCO will not.
- Yield losses greater than 14% when SCO begins to trigger, and ECO-95 and ECO-9090 would have triggered their maximum payments.
The bottom panel shows a similar breakdown for revenue losses.
Corn
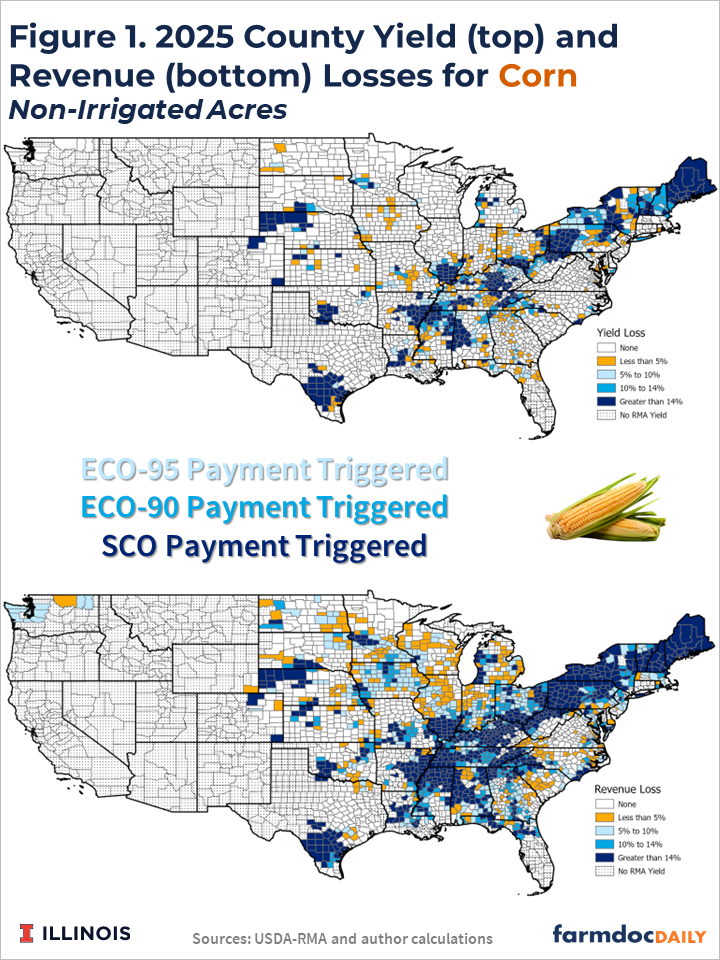
Figure 1 shows county yield and revenue losses for non-irrigated corn. The average corn yield in the U.S. in 2025 was a record high 186.5 bushels per acre (USDA, 2026). Still, various counties had actual yield estimates below their expected yields for non-irrigated corn.
Yield losses were large enough to trigger payments from SCO with YP in 14% of the 2,319 counties with a county yield reported for non-irrigated corn in 2025. ECO-90 (ECO-95) with YP triggered payments in 19% (28%) of the counties for corn. The largest SCO and ECO losses were concentrated in areas of northwestern Nebraska, southern Oklahoma, southern Texas, eastern Arkansas, western Mississippi, central Tennessee, central Kentucky, southern Illinois, and southern Ohio into western Pennsylvania. Yields were also below expected levels for most of the counties in the northeast US, although these areas have relatively few corn acres.
Revenue losses for non-irrigated corn, shown in the bottom panel of figure 1, are larger and more widespread because the harvest price for corn ($4.22 per bushel) was below the projected price ($4.70 per bushel) by 10.2%. SCO with RP or RP-HPE triggered payments in 29% of the non-irrigated corn counties. This increases to 40% of counties for ECO-90 and 57% for ECO-95. The areas with the larger relative yield losses discussed above will trigger maximum payments from the ECO, as well as payments on SCO, when coupled with RP or RP-HPE. A number of additional counties in Iowa, the northern parts of Illinois, Indiana, and Ohio, the upper Midwest (Minnesota, Wisconsin and Michigan), the Dakotas and southern Texas will trigger payments on revenue-based ECO.
Soybeans
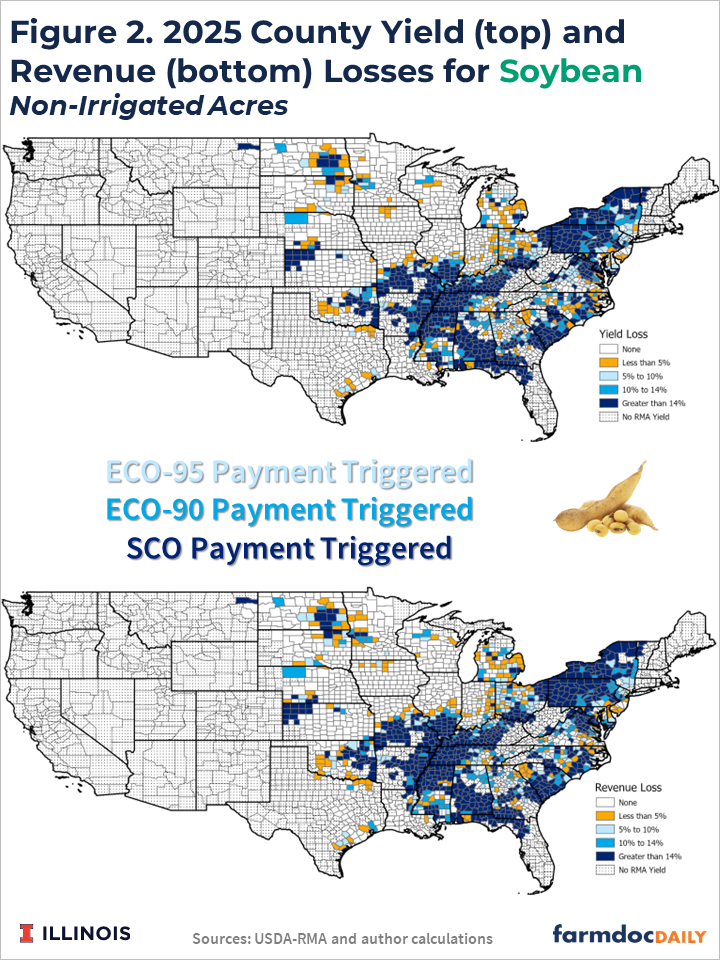
Figure 2 shows yield (top) and revenue losses (bottom) for non-irrigated soybeans. Similar to corn, the average soybean yield for the U.S. was a record high in 2025 (53 bushels per acre) but certain areas experienced yields below expected levels (USDA, 2026).
County yield losses for soybeans were largest in some counties in the Dakotas, western Kansas, southern Missouri, southern Illinois, southern Ohio, eastern Arkansas, western Tennessee, western Kentucky, and parts of Mississippi, Georgia, and Florida. Soybean yield losses were also large in eastern states from the Carolinas north to Pennsylvania and New York. SCO with YP triggered payments in 31% of the 2,008 counties with a non-irrigated soybean yield reported for 2025. This increases to 38% (48%) for ECO-90 (ECO-95) with YP.
As with corn, the harvest price for soybeans ($10.35) was below the projected price ($10.54) by 1.8% so that revenue losses were slightly larger than yield losses in all areas. Many counties will trigger the max ECO payment as well as SCO payments in major soybean production areas such as southern Missouri and Illinois, eastern Arkansas, western Kentucky and Tennessee, and northern Mississippi. Revenue based ECO payments will also be triggered in scattered areas of the Dakotas, Minnesota, Wisconsin, Michigan, and Ohio. SCO with RP or RP-HPE triggered payments in 34% of counties for non-irrigated soybeans. ECO-90 (ECO-95) trigger payments in 41% (51%) of counties.
Wheat
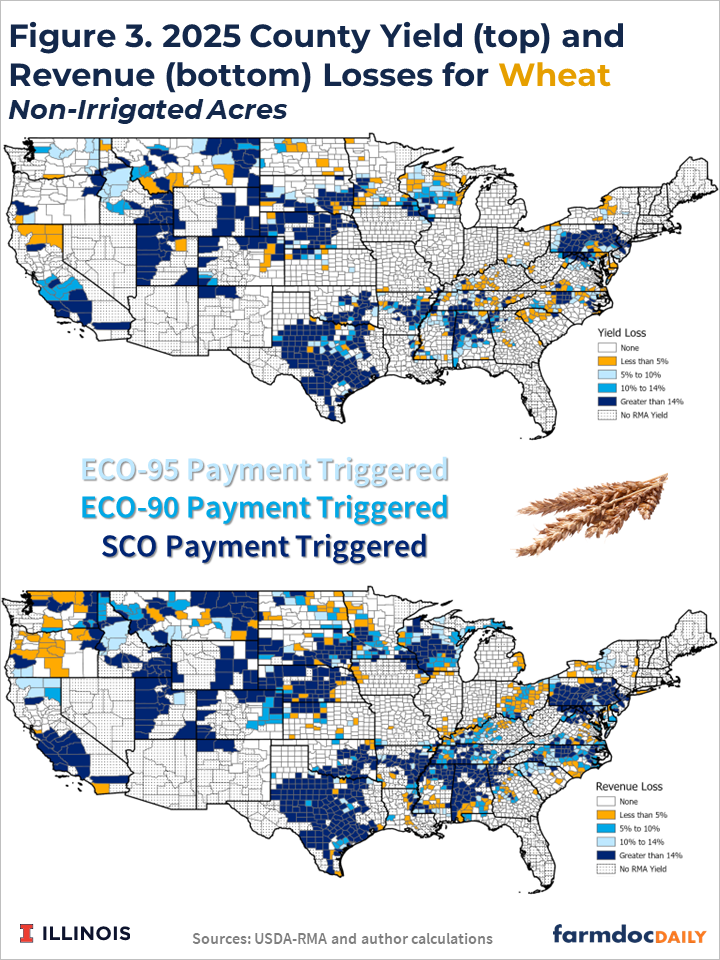
Figure 3 shows county yield (top) and revenue (bottom) losses for non-irrigated wheat. The all wheat yield for the U.S. in 2025 was estimated at 53.3 bushels per acre (USDA, 2025). Yield losses sufficient to trigger SCO with YP payments occurred in just over 20% of the 2,296 counties with a non-irrigated wheat yield reported for 2025. This increases to 25% (33%) of counties triggering payments from ECO-90 (ECO-95) when coupled with YP.
Revenue losses triggering SCO with RP or RP-HPE occurred in just over 30% of counties. This increases to 39% (48%) for ECO-90 (ECO-95).
ECO and SCO payments were triggered in a number of counties in the major wheat producing areas of the northwestern US and Great Plains states. A number of counties experienced losses that would trigger ECO and SCO payments in other relatively large wheat producing states such as Minnesota. Few counties experienced sufficient yield or revenue losses to trigger supplemental area plan payments for non-irrigated wheat in Iowa, Illinois, Missouri, or Indiana. Losses were also sufficient to trigger payments on wheat acres in areas of the southeastern and eastern U.S. but wheat acreage and production is relatively small in these regions.
Summary
Despite record national average yields for corn, soybeans, and wheat in 2025, yield losses relative to expected yield levels were estimated to occur in many regions. Areas with yield losses, combined with harvest prices that were below the projected prices for all three crops, resulted in a number of counties where ECO and SCO payments will be triggered for the 2025 crop year.
References
Paulson, N. and J. Coppess. "2014 Farm Bill: The Supplemental Coverage Option." farmdoc daily (4):37, Department of Agricultural and Consumer Economics, University of Illinois at Urbana-Champaign, February 27, 2014.
Paulson, N., G. Schnitkey, K. Swanson and C. Zulauf. "The New Enhanced Coverage Option (ECO) Crop Insurance Program." farmdoc daily (10):203, Department of Agricultural and Consumer Economics, University of Illinois at Urbana-Champaign, November 24, 2020.
Schnitkey, G., N. Paulson and C. Zulauf. "Enhanced Coverage Option for 2025." farmdoc daily (15):26, Department of Agricultural and Consumer Economics, University of Illinois at Urbana-Champaign, February 11, 2025.
Schnitkey, G., N. Paulson, C. Zulauf and H. Monaco. "Common Questions on SCO and ECO." farmdoc daily (16):30, Department of Agricultural and Consumer Economics, University of Illinois at Urbana-Champaign, February 24, 2026.
USDA. 2025. Small Grains – 2025 Summary, September 2025.
USDA. 2026. Crop Production – 2025 Summary, January 2026.
Disclaimer: We request all readers, electronic media and others follow our citation guidelines when re-posting articles from farmdoc daily. Guidelines are available here. The farmdoc daily website falls under University of Illinois copyright and intellectual property rights. For a detailed statement, please see the University of Illinois Copyright Information and Policies here.