








How Do Differences Between High and Low Profit Farms Change with Income?
Last month, we looked at characteristics of higher profit farms using a twenty-year average and different regions of the state (see farmdoc daily, June 22, 2026). Using data from the Illinois Farm Business Farm Management (FBFM) Association from 2001 through 2025, we will look at three different three-year medians that have varying levels of income to analyze selected differences between the highest profit grain farms (high one-third) and the lowest profit grain farms (low one-third). The farms were sorted into thirds based on production per dollar of non-feed costs (accrual gross farm returns divided by total economic non-feed costs).
For this study, we analyze farms in central Illinois with higher productivity soils. There is very little livestock on these farms, and they all were 500 acres or more. The highest income per acre group was 2012, 2021, and 2022. The average income for this group ranged from $333 per acre to $433 per acre. The middle income per acre group was 2004, 2009, and 2014. The average income for these years ranged from $106 per acre to $118 per acre. The lowest income group included 2002, 2015 and 2024 with income ranging from $1 per acre to $41 per acre.
Farm Size and Land Tenure
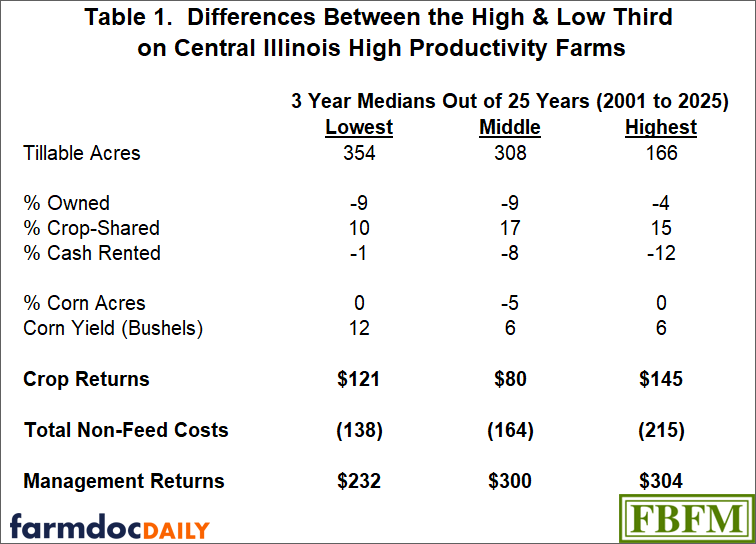
Table 1 shows the differences in selected factors between the high and low third farms in central Illinois with the higher productivity soils based on the three income groups. When looking at differences in tillable acres during these different periods, the high one-third of the farms tend to be much larger than the low one-third during times of lower incomes. As income increased, the difference in acres between the high and low thirds decreased. During periods of higher incomes, the high one-third of the farms had 12 percent less of their total acres cash rented than the low one-third. This difference was only one percent less in low-income years.
Corn Yield & Rotation
In central Illinois with the higher soil ratings, the higher profit farms had zero to five percent fewer acres of corn in their crop rotation, with the highest and lowest years during this time showing no difference in the percent of corn acres planted. When looking at corn yield over these periods of time, the difference between the high and low groups narrowed as income increased. In the lowest 3 year median the difference in corn yield was 12 bushels per acre while it was only 6 bushels per acre in the middle and highest 3 year medians. However, the crop return difference, a large component of gross farm income, is larger in times of higher incomes. The same holds true for management returns, but they are only slightly higher than the middle 3 year medians.
Expenses
Table 1 shows the difference between the high profit and low profit groups for total non-feed costs. Over the different incomes, the difference in cost increased in times of higher incomes. In Figure 1, we see expenses broken into five expense categories, by the same three-year medians. The expenses listed not only include cash costs, but also accrual adjustments as well as economic charges for items such as unpaid labor (family or farm operator) and interest charges on non-land and land. When looking at the graph, we see that crop costs have varied some over time but are not impacted by the level of income during this period with the middle 3 year median having the largest difference, with higher profit farms having $45 per acre lower costs than the lower profit farms. For the power and equipment group, as income increases, the difference increased with the higher profit farms having lower costs.
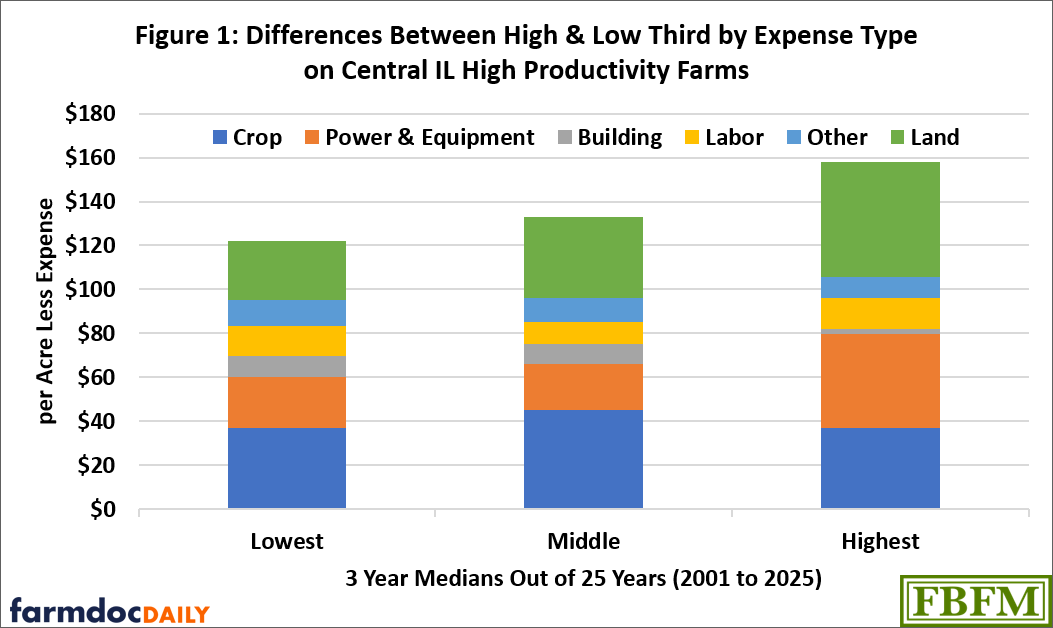
As we look at the remaining expense categories, there seems to be more impact based on income. For the categories of buildings and other expenses, these tend to show much larger differences between the high one-third and low one-third groups during periods of lower income (these costs are much lower for the high one-third during lower incomes). However, when we look at land costs during periods of higher income, there are much larger differences between the higher and lower profit groups. This means that the land costs are much lower for the higher profit groups when incomes are higher.
Summary
There are many differences between the high one-third and low one-third farms in Illinois. As we can see from this subset of Illinois FBFM farms that are in central Illinois, the differences can also be affected by income levels. By using three-year medians over the last twenty-five years, we have tried to normalize some of the differences. When looking at expenses, we can see in general buildings and other costs (insurance, miscellaneous costs, non-land interest charges, etc) are typically much lower for the higher profit farms when incomes are lower on average. Power and equipment costs and land costs are typically much lower for the higher profit groups during periods of higher incomes. As farmers are beginning to plan for the 2027 season, keep in mind some of these thoughts and observations. Careful analysis of these differences in your own farm business begins with good records that are consistent over time.
The author would like to acknowledge that the data used in this study comes from the Illinois Farm Business Farm Management (FBFM) Association. Without Illinois FBFM, information as comprehensive and accurate as this would not be available for educational purposes. FBFM, which consists of 4,900+ farms and 80 professional field staff, is a not-for-profit organization available to all farm operators in Illinois. FBFM field staff provide independent, on-farm counsel along with recordkeeping, farm financial management, business entity planning and income tax management. For more information, please contact our office located on the campus of the University of Illinois at 217-333-8346 or visit the FBFM website at www.fbfm.org.
Issued by Bradley L. Zwilling, Illinois FBFM Association and Department of Agricultural and Consumer Economics, University of Illinois
References
Zwilling, B. "The Characteristics of Higher Profit Farms in Illinois, 2006 – 2025 Average." farmdoc daily (16):108, Department of Agricultural and Consumer Economics, University of Illinois at Urbana-Champaign, June 22, 2026.
Disclaimer: We request all readers, electronic media and others follow our citation guidelines when re-posting articles from farmdoc daily. Guidelines are available here. The farmdoc daily website falls under University of Illinois copyright and intellectual property rights. For a detailed statement, please see the University of Illinois Copyright Information and Policies here.