








Historic Corn and Soybean Profitability and 2027 Planting
Soon, the decision-making process for the 2027 crop will begin in earnest, and Midwest farmers will begin making acreage choices between corn and soybeans. In this article, we build on historical differences between corn and soybean profitability presented in an earlier article (see farmdoc daily, June 2, 2026) by evaluating relative returns across regions in Illinois and breaking out profitability differences into revenue and cost components. Across all regions, soybeans have been more profitable than corn in most years since 2012. This history suggests that soybeans will be more profitable than corn in 2027 because crop prices likely will be near long-run averages, general cost inflation will increase corn costs more than soybean costs on a per acre basis, and nitrogen fertilizer prices will be high thereby dis-advantaging corn production.
Corn-Minus-Soybean Returns
We regularly summarize Farm Business Farm Management (FBFM) data, providing per acre revenue and cost averages for Northern, Central, and Southern Illinois, with Central Illinois further divided into farmland with high productivity and farmland with low productivity. These results are reported in Revenue and Costs for Illinois Grain Crops and serve as the starting basis for the projections contained in the Illinois Crop Budgets.
In this article, we report the difference between corn returns and soybean returns, hereafter referred to as corn-minus-soybean returns. In 2024, for example, the operator and land return in central Illinois was $281 per acre for corn vs. $322 per acre for soybeans. The corn-minus-soybean return is $41 per acre, equal to the $281 per acre corn return minus the $322 soybean return. The negative return indicates that soybeans are more profitable than corn.
Figure 1 shows corn-minus-soybean returns for all four regions from 2000 to projections for 2026. Prior to 2013, corn-minus-soybean returns were positive, indicating that corn was more profitable than soybeans. Between 2006 and 2012, corn use in ethanol grew, leading to demand for relatively more corn acres. Since 2013, corn-minus-soybean returns have been negative in most years except 2020, 2021, and 2022. The exception years are when crop prices are above their long-term plateaus of around $4.50 for corn and $11.00 for soybeans that exist since 2006 (see farmdoc daily, July 9, 2024). When prices are near or below these long-run averages, soybeans tend to be more profitable than corn.
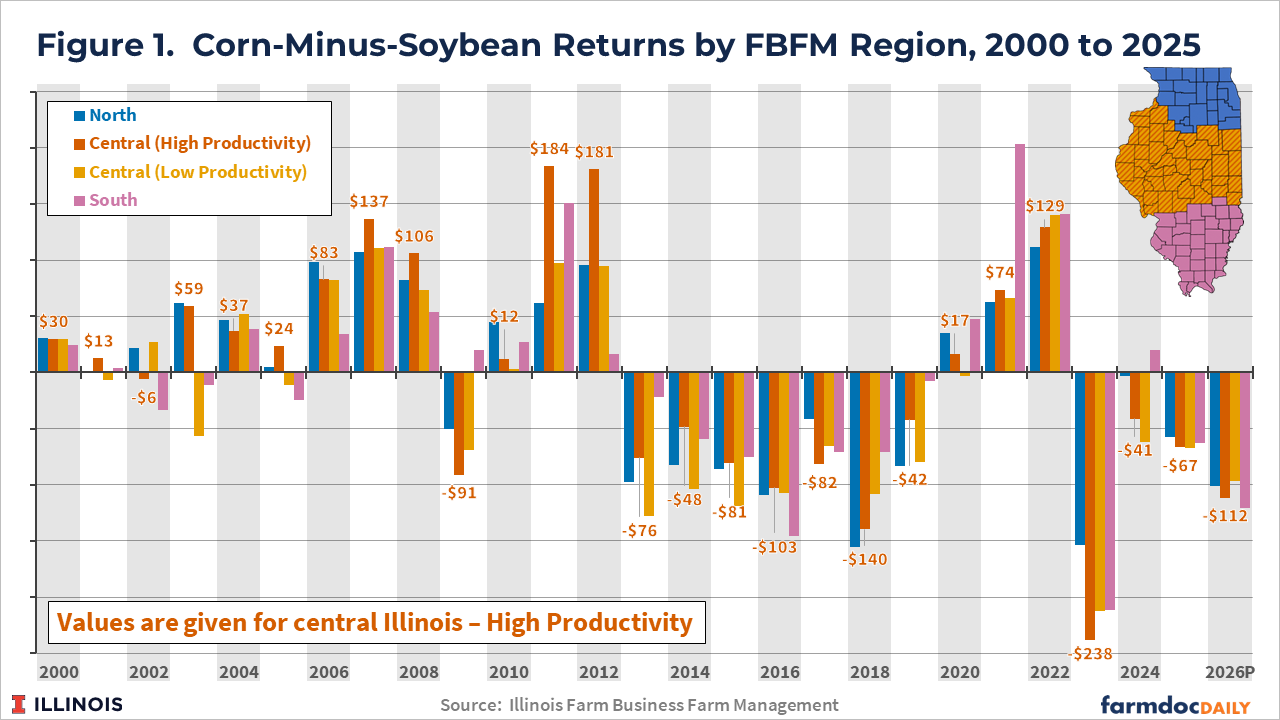
Those relationships hold over all of Illinois. Overall,
- Central Illinois with high-productivity farmland is the most productive region.
- Northern Illinois is the second most productive.
- Central Illinois with low-productivity farmland is the third most productive.
- Southern Illinois is the fourth most productive.
No matter the productivity, corn-minus-soybean returns have the same basic historic trends and relationships across regions. Those regions also have different percentages of the acres in corn, with northern Illinois having the highest percentage, followed by central Illinois, and then by southern Illinois (see farmdoc daily, June 2, 2026).
Components of Corn-Soybean Returns
To further analyze how relative profitability changes over time, corn-minus-soybean returns are broken down into revenue and cost components in Figure 2. The line in Figure 2 shows corn revenue minus soybean revenue. The bars show total non-land costs of corn minus total non-land costs of soybeans. Bars further break down costs into fertilizer, other direct, labor, and overhead categories. When corn-minus-soybean revenue is above corn-minus-soybean cost, corn is more profitable than soybeans. Conversely, soybeans are more profitable than corn when corn-minus-soybean revenue are less than corn-minus-soybean costs.
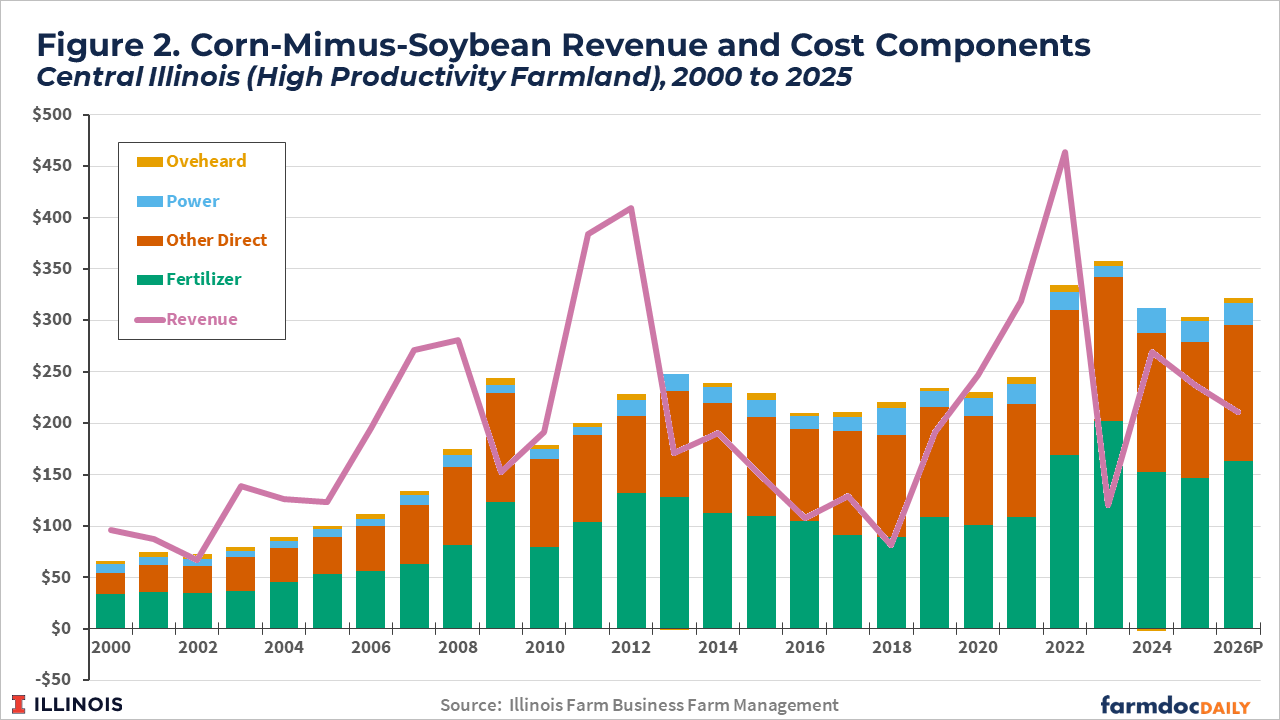
During the first part of the 2000s, corn revenue increased more than soybean revenue. Since the mid-2000s, there has been no discernible trend in corn-minus-soybean revenue. Between 2006 and 2026, corn-minus-soybean revenues have averaged $227 per acre, with a great deal of variability around that average. Corn revenue relative to soybean revenue tends to be higher in high-price years such as those that occurred between 2010 and 2012 and again in 2021 and 2022. Corn revenue relative to soybean revenue tends to be lower in lower-price years, as occurred between 2013 and 2019, and again in 2023 through 2026.
Corn-minus-soybean costs have shown a general upward trend over time. That trend is associated with general cost inflation. Since corn is a more costly crop to grow, the same percentage increase in costs results in larger costs increases for corn than soybeans on a dollar per-acre basis.
Figure 2 also shows components of costs divided into:
- Fertilizer costs. Fertilizer costs have grown over time and also show variability. The cost difference between corn and soybeans tends to widen with higher nitrogen fertilizer prices, such as in 2009 and since 2022. Corn uses nitrogen fertilizer while soybeans don’t need nitrogen fertilizer.
- Other direct costs include all the direct costs excluding fertilizer. That would include seed, pesticides, drying, storage, and crop insurance.
- Power costs include all items related to machinery, including machinery hire, utilities, machinery repair, fuel and oil, light vehicle, and machinery depreciation.
- Overhead costs include hired labor, building repairs and rent, building depreciation, Insurance, miscellaneous, and non-land interest.
Changes in power and overhead costs have little impact on the total cost difference between corn and soybeans (see Figure 2). Fertilizer has a large impact, with nitrogen fertilizer prices having a large impact on year-to-year variability. The other direct costs also have had an increasing impact over time.
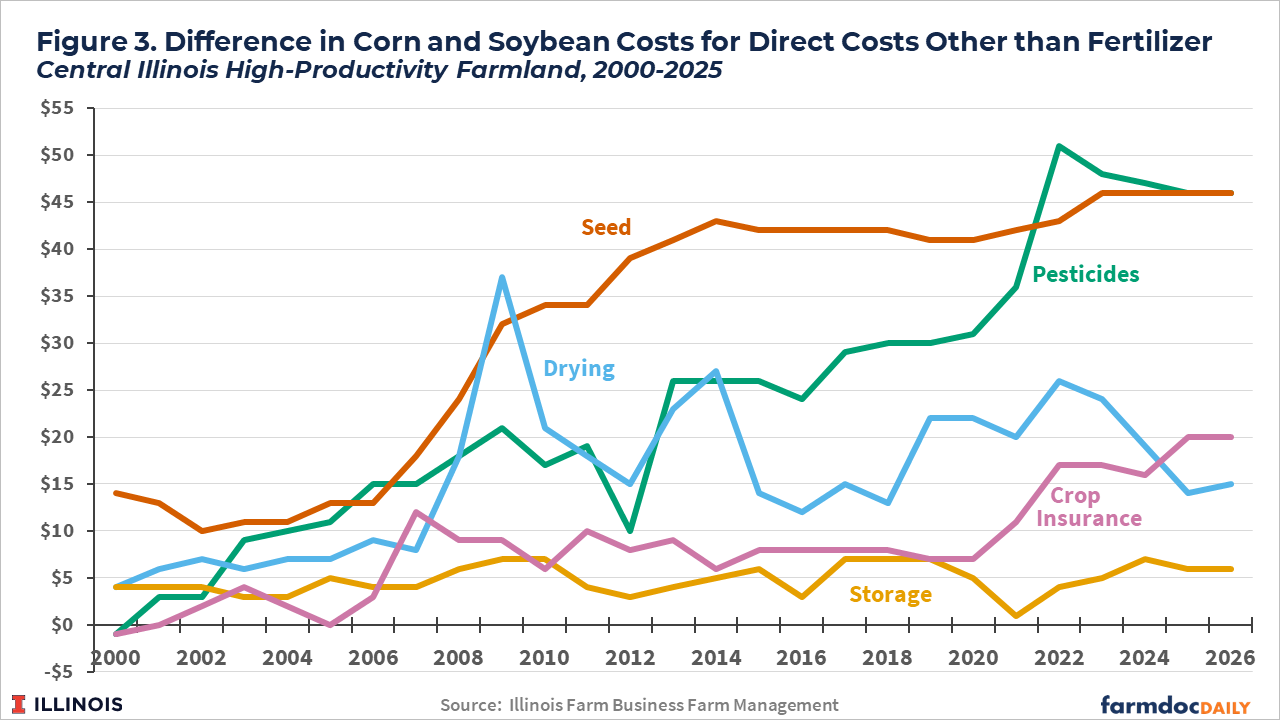
Figure 3 shows the impacts the other direct items have on cost difference:
- Seed costs have increased more for corn than for soybeans, with significant corn-minus-soybean seed cost increases occurring between 2006 and 2014. The cost difference again widened between 2022 and 2023.
- Corn-minus-soybean pesticide costs have increased over time, indicating that corn herbicide, fungicide, and insecticide costs have increased more than their soybean costs. Those differences vary from year to year, likely indicating differences in pest severity between corn and soybeans.
- Corn-minus-soybean insurance costs have increased, particularly since 2020.
- Cost differences between drying and storage have remained relatively stable since 2010.
Implications for 2027 Acreage Decisions and Beyond
Overall, the historical dynamics in this article suggest that soybeans will be more profitable than corn, perhaps at even larger levels than in recent years. Those dynamics include:
- Corn and soybean prices roughly at levels faced in recent years, which are near historical plateaus. In recent history, those prices are associated with higher relative returns for soybeans.
- High nitrogen fertilizer prices. The U.S. – Iran conflict has brought on higher nitrogen prices. Those prices likely will continue into 2027 as the conflict does not appear to be resolving soon. Those higher prices will reduce corn returns relative to soybean returns.
- General cost inflation seems likely to continue into 2027. That general trend will likely increase soybean returns relative to corn returns.
We anticipate that soybeans will be projected more profitable than corn when we release 2027 Crop Budgets. As a result, farmers may wish to consider planting more soybeans than corn.
What that does to rotations will vary by region. In northern Illinois, for example, the average crop rotation has corn planted on 60% of total acres, suggesting that more soybean acres could be planted without having soybeans following soybeans. In central Illinois, corn acres in the rotation have been about 52% of total acres, suggesting that a switch to more soybeans will result in some soybeans-after-soybeans. The production practices associated with those changes need careful consideration. Southern Illinois farmers already only have 40% of their acres in corn, but also has wheat in the rotation. More soybeans would require adjustments in southern Illinois as well.
We note that soybeans have been and likely will be projected to be more profitable than corn in northern and central Illinois, the heart of the Corn Belt – an area where the relative profitability of corn would be viewed as an indicator for other regions. Thus, one should expect other areas to also be facing conditions that would suggest higher relative profitability for soybeans over corn. The extent to which those expectations will impact producers’ acreage decisions for the 2027 crop year will start to be determined in the coming months as planning begins.
References
Paulson, N., G. Schnitkey and C. Zulauf. "Historical Corn versus Soybean Returns in Illinois." farmdoc daily (16):96, Department of Agricultural and Consumer Economics, University of Illinois at Urbana-Champaign, June 2, 2026.
Schnitkey, G., N. Paulson and C. Zulauf. "Corn and Soybeans Economics in 2024 and 2025: Back to the New (Old) Normal?" farmdoc daily (14):126, Department of Agricultural and Consumer Economics, University of Illinois at Urbana-Champaign, July 9, 2024.
Disclaimer: We request all readers, electronic media and others follow our citation guidelines when re-posting articles from farmdoc daily. Guidelines are available here. The farmdoc daily website falls under University of Illinois copyright and intellectual property rights. For a detailed statement, please see the University of Illinois Copyright Information and Policies here.