








Initial 2025 FSA Yields and ARC-CO for Corn, Soybeans, and Wheat
The Farm Service Agency (FSA) of the USDA has released some final county yields for the 2025 crop year. Based on the USDA’s latest estimates for the 2025 marketing year average prices for corn and soybeans, the county yields suggest ARC-CO payments will be widespread with about half of counties triggering payments and many counties triggering the maximum payment. Reported yields and the final MYA price for wheat indicate ARC-CO payments in more than 80% of counties, with over half of counties triggering the maximum payment rate.
ARC-CO for 2025
The One Big Beautiful Bill Act (OBBBA), signed into law just over a year ago on July 4th, 2025, made a number of changes to programs in the commodity title of the farm bill which took effect for the 2025 crop year (see farmdoc daily article from July 15, 2025). The changes to the county version of the Agriculture Risk Coverage (ARC-CO) program were as follows:
- Payments are now triggered if actual county revenue falls below 90% of the benchmark revenue. Previously, payments were triggered at 86%.
- The maximum payment rate is 12% of benchmark revenue so that the program covers the band from 90% down to 78% of the benchmark. Previously the maximum payment rate was 10%, covering from 86% down to 76%.
- Increases in the statutory reference prices and adjustments to effective reference price calculations for the PLC program also impact ARC given their role in setting ARC’s benchmark price each year.
- For 2025 only, farmers will receive the higher of a crop’s per base acre payment rate from the ARC or PLC programs. Thus, program enrollment decisions made in March 2025, prior to the changes made in OBBBA, will not affect final support levels received by producers.
The sections below discuss the yields released by FSA for corn, soybeans, and wheat and what they indicate about ARC-CO payment rates for 2025.
Corn
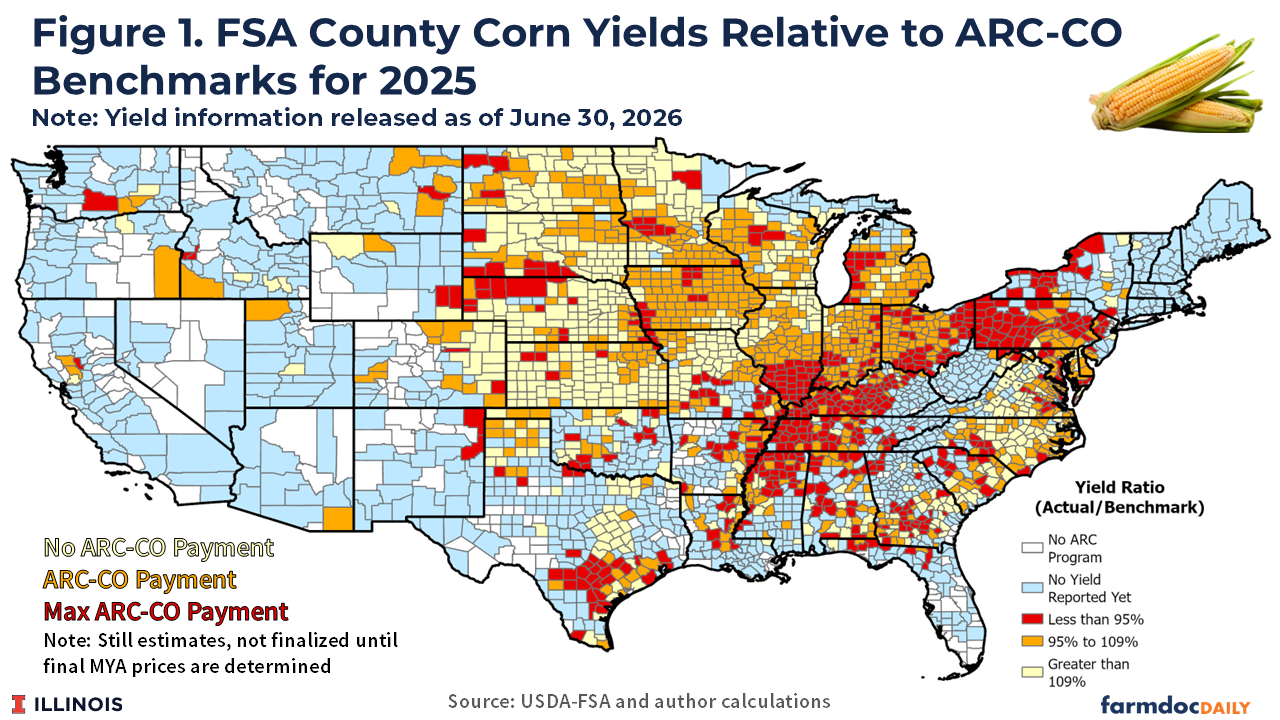
As of June 30th, FSA has released final county yields for 70% of the county and practice (all, non-irrigated, or irrigated) combinations for which ARC-CO program parameters are provided for corn (see the excel file for 2025 ARC-County Benchmark Yields and Revenues on FSA’s ARC/PLC program data page). Figure 1 illustrates where corn county yields have been reported by FSA for 2025 for non-irrigated or all practices.
The 2025 ARC benchmark price for corn was $5.03 per bushel. The latest 2025 MYA price estimate for corn from USDA’s July WASDE report was $4.15, or 17.5% below the benchmark price. At this MYA price level, ARC-CO would trigger payments in counties with yields at or below 109% of the county benchmark yield (0.90 divided by 0.825 = 1.09). The maximum ARC-CO payment for corn would be triggered in counties where the actual yield is at or below 95% of the county’s benchmark (0.78 divided by 0.825 = 0.95).
Figure 1 classifies the counties with all or non-irrigated practices into three ARC-CO payment categories. Counties in yellow have a final county yield high enough to offset the price decline with no ARC-CO payment being triggered. At the current MYA price estimate of $4.15, no ARC-CO payment would be triggered in 20% of all county and practice combinations for corn.
Counties in orange have a reported yield which triggers an ARC-CO payment in the 12% payment band. This would occur in 30% of all county and practice combinations for ARC-CO for corn at the $4.15 price.
Counties in red have a reported yield which would imply the maximum ARC-CO payment rate of 12% of the county’s benchmark revenue. This would occur in 20% of all county and practice combinations for ARC-CO for corn at the $4.15 price.
Soybeans
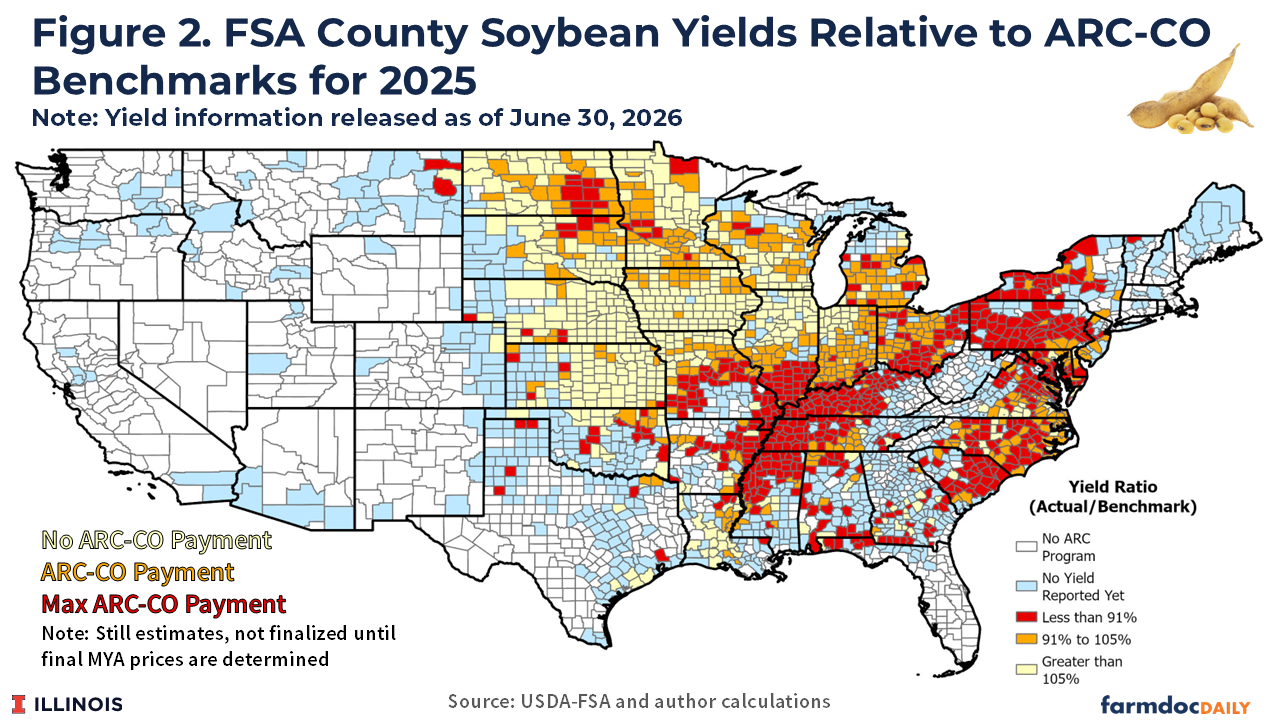
Final county yields are available for 71% of the county and practice combinations for which ARC-CO program parameters are provided for soybeans. Figure 2 illustrates where soybeans county yields have been finalized and reported by FSA for 2025 for non-irrigated or all practices.
The 2025 ARC benchmark price for soybeans was $12.17 per bushel. The latest 2025 MYA price estimate for soybeans from USDA’s July WASDE report was $10.40, or 14.5% below the benchmark price. At this MYA price level, ARC-CO would trigger payments in counties with soybean yields at or below 105% of the county’s benchmark yield. The maximum ARC-CO payment for soybeans would be triggered in counties where the actual yield is at or below 91% of the county’s benchmark.
Figure 2 classifies the counties with all or non-irrigated practices into the same ARC-CO payment categories as for corn in figure 1. As with corn, these are calculated using the current MYA price estimate for soybeans of $10.40 Counties in yellow have a final county yield high enough to offset the price decline with no ARC-CO payment being triggered for soybeans. No ARC-CO payment would be triggered in 24% of all county and practice combinations.
Counties in orange have a reported yield which triggers an ARC-CO payment in the 12% payment band. This would occur in 23% of all county and practice combinations for ARC-CO for soybeans.
Counties in red have a reported yield which would imply the maximum ARC-CO payment rate of 12% of the county’s benchmark revenue. This would occur 23% of all county and practice combinations for ARC-CO for soybeans.
Wheat
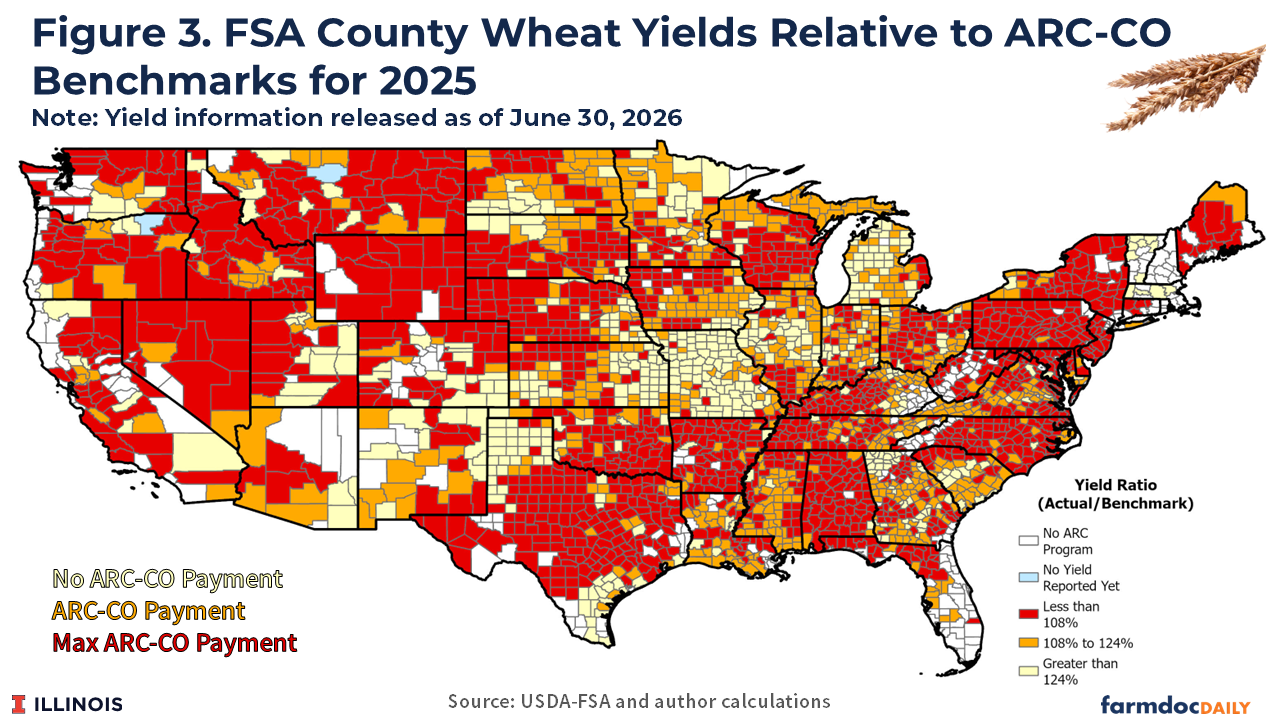
Final county yields for wheat are available for virtually all of the county and practice combinations for which ARC-CO program parameters are provided for wheat. Exceptions include Chouteau County in Montana and Umatilla County in Oregon. Figure 3 illustrates the wheat county yields that have been finalized and reported by FSA for 2025 for non-irrigated or all practices.
The 2025 ARC benchmark price for wheat was $6.98 per bushel. Wheat’s 2025 MYA price has been finalized at $5.06 per bushel, or 27.5% below the benchmark price. At this MYA price level, ARC-CO would trigger payments in counties with wheat yields well above benchmark levels. Wheat yields at or below 124% of the county’s benchmark yield will trigger a payment. The maximum ARC-CO payment for wheat would be triggered in counties where the actual yield is at or below 108% of the county’s benchmark.
Figure 3 classifies the counties with all or non-irrigated practices into the same ARC-CO payment categories as for corn and soybeans (figures 1 and 2, respectively). Counties in yellow have a final county yield high enough to offset the price decline with no ARC-CO payment being triggered for wheat. No ARC-CO payment would be triggered in 19% of all county and practice combinations.
Counties in orange have a reported yield which triggers an ARC-CO payment in the 12% payment band. This occurs in 27% of all county and practice combinations for ARC-CO for wheat.
Counties in red have a reported yield which would imply the maximum ARC-CO payment rate of 12% of the county’s benchmark revenue. This occurs in 53% of all county and practice combinations for ARC-CO for wheat.
Summary
Changes to the ARC-CO program made in the OBBBA and effective for 2025 increased the support level at which payments are triggered and widened the maximum payment band. Current estimates for 2025 MYA prices, coupled with the initial release of about 70% of the final county yields, suggest that ARC-CO payments will be triggered in just over half of counties for corn and nearly half of counties for soybeans. Payment rates are estimated to hit their maximum in 20% of counties for corn and 23% of counties for soybeans. Virtually all wheat yields have been released. Wheat’s MYA price is also finalized and well below the 2025 benchmark price. More than 80% of counties triggered ARC-CO payments for wheat, with 53% of counties triggering the maximum payment rate.
The maps provided in this article indicate where ARC-CO payments are expected to be triggered as well as where the maximum payment rate is expected to be triggered. For specific payment rate estimates for all program crops and counties across the US we refer readers to the interactive payment estimate map tool made available by Robin Reid at Kansas State University.
For corn and soybeans, ARC-CO payments will be compared with PLC payments when MYA prices are finalized. As of the July 10 WASDE estimates from USDA, corn and soybeans have projected 2025 PLC payment rates of $0.27 ($4.42 effective reference price minus $4.15 estimated MYA price) and $0.31 ($10.71 minus $10.40) per bushel, respectively. Thus, producers with corn or soybean base are likely to receive a payment based on PLC even if they are in counties where an ARC-CO payment is not triggered, and in some cases the PLC payment rate may exceed the ARC-CO payment rate. For wheat the PLC payment rate is $1.29 per bushel ($6.35 minus $5.06). Thus, producers with wheat base will receive support in October even if they are in a county that did not trigger an ARC-CO payment for wheat, and in some cases the PLC payment may be larger even in areas where ARC-CO did trigger.
The variation across counties in terms of where ARC-CO did, or is expected to, trigger payments, and the variation in the size of those payments, reflects the yield variation experienced across the US at the county level. Revenues for all counties are impacted by the same price declines but larger payment rates will occur in areas where yield performance was poorer relative to expectations as measured by ARC-CO’s county benchmark yields. This highlights the design of ARC-CO in targeting support to areas which experienced revenue losses relative to the program’s measure of county-level benchmark revenue.
References
FSA. 2026. ARC/PLC Program Data. Farm Service Agency, United States Department of Agriculture. https://www.fsa.usda.gov/resources/programs/arc-plc/program-data
Schnitkey, G., N. Paulson, C. Zulauf and J. Coppess. "Impacts of the Commodity Title Changes Under the One Big Beautiful Bill Act (OBBBA) for Midwestern Farms in 2025." farmdoc daily (15):128, Department of Agricultural and Consumer Economics, University of Illinois at Urbana-Champaign, July 15, 2025.
Reid, R. 2026. National ARC County 2025/2026 Estimates. AgManager, Agricultural Economics, Kansas State University, July 9, 2026. https://www.agmanager.info/national-arc-county-20252026-estimates
Disclaimer: We request all readers, electronic media and others follow our citation guidelines when re-posting articles from farmdoc daily. Guidelines are available here. The farmdoc daily website falls under University of Illinois copyright and intellectual property rights. For a detailed statement, please see the University of Illinois Copyright Information and Policies here.