








Foreign Ownership of U.S. Agricultural Land
This article examines foreign ownership of US farmland and introduces an interactive mapping utility developed by the TIAA Center for Farmland Research that allows identification and delineation of foreign ownership by county, type, and use; along with the rankings of countries represented among the foreign ownership data.
The Agricultural Foreign Investment Disclosure Act (AFIDA) has required foreign persons to report their interests in U.S. agricultural land since 1978. For most of that time the annual AFIDA report attracted limited attention beyond the USDA and the academic research community. Over the past few years however, foreign investment in farmland has become a politically charged issue with regular assertions by politicians and in the farm press that foreign interests are buying significant shares of US farmland and posing a threat to National Security interests. In response, many states have reviewed or updated their laws on foreign ownership of agricultural land and numerous state and federal proposals have been introduced in the last two years to change reporting and oversight (see https://nationalaglawcenter.org/foreign-investments-in-ag/ for summaries of state and federal proposals). In any case, AFIDA results in a dataset that allows a systematic tabulation of foreign holdings in a consistently collected framework through time which allows for a more factual understanding of actual foreign holdings. In January 2026 USDA released its most recent report AFIDA covering holdings through December 31, 2024, alongside a new online portal for filing disclosures. These data are used in the following and in the utility which will continue to reflect the most recent data each time new filings are available.
AFIDA Data – What is Included?
In total, AFIDA identifies 46.3 million acres of U.S. agricultural land in which a foreign interest holds a reportable position. Reportable positions are generally defined as any interest in agricultural land of ten acres or more. The term “interest in” is broader than direct ownership including leases of ten years or longer, which is the form most wind and solar developers use to assemble land for potential future developments. Furthermore, the term “agricultural land” includes forestland, farmland held for both crop cultivation and pastureland, and other agricultural land. Nearly half of the total acreage reported in AFIDA is forest land, and holders from Canada account for the largest share of that category by a wide margin. Leaseholds also represent a substantial fraction of the total due to the typical feature that say an 80-acre field has the potential for a wind tower which might occupy roughly one acre if developed, while the owner retains ownership of the remainder for all practical purposes.
The design of the requirements and the reporting requirements includes location to the county level, ownership identification (e.g. name) and type (e.g., corporation, individual, etc.), country of citizenship, acres, type of ownership (fee simple, partial, life estate, trust, purchase contract, lease, etc.), acquisition and valuation details, and primary uses delineated across forest, crop, pasture, and non-agricultural (e.g., solar). Shares of ownership and citizenship codes can include partial interests shared with US citizen owners, and secondary or “look through” ownership records. Parcels connected to China, Russia, Iran, and N. Korea require additional reporting in the form of noting those relationships.
Some records indicate a low zero percentage of the asset is currently controlled by a foreign interest but remains in the dataset, presumably within a structure such as a public fund that could accommodate traded equity ownership (e.g. a publicly traded company like Tysons or Smithfield Foods), and some have no usable single country code, but these cases represent a very small fraction of the total. Additionally, some reported parcels are actually owned by US interest, but reported into the system for unknown reasons. Finally, the share of ownership is required in addition to total acreage to allow for example, a shared ownership interest in 80 acres that is owned 50% by a foreign interest to be distinguished from full ownership and is attributed 40 acres in total calculations as a result. Records were excluded from the acreage counts with a share of foreign ownership listed as zero, or if the ownership country code is US.
As the academic and political interests in ownership records seem to be somewhat concentrated on farmland used in crop production, sensible segregations of the data among forestland used for commercial timber purposes, and leaseholds related to renewable energy were categorized and tabulated separately for sub analyses. Within the farm and timber related categories, simple fee ownership, partial fee interests, life estates, trust beneficiary interests, and purchase contracts are the primary forms of ownership interest included. And, the small amount of non-agricultural land that was reported (under 1 million acres) is excluded.
In total the AFIDA report contains 49,548 records with 47.2 million reported acres, of which 46.3 million are agricultural land (cropland, pasture, forest, and other agricultural land). Long-term leases represent 16.3 million acres, or about a third of the total. Codes indicating no predominant country or no foreign investor account for about 2.9 million acres or 6 percent of the total, and these are distributed across of every interest type. The remaining focus is on affirmatively identified foreign interests excluding cases with no reported foreign country code. While other tabulations are also possible, this approach provides the collection of parcels for which foreign ownership interests are most completely confirmed. The following materials report and discuss specific items of interest that are evident in this specific subset of the data.
Foreign Ownership as a Share of U.S. Farmland
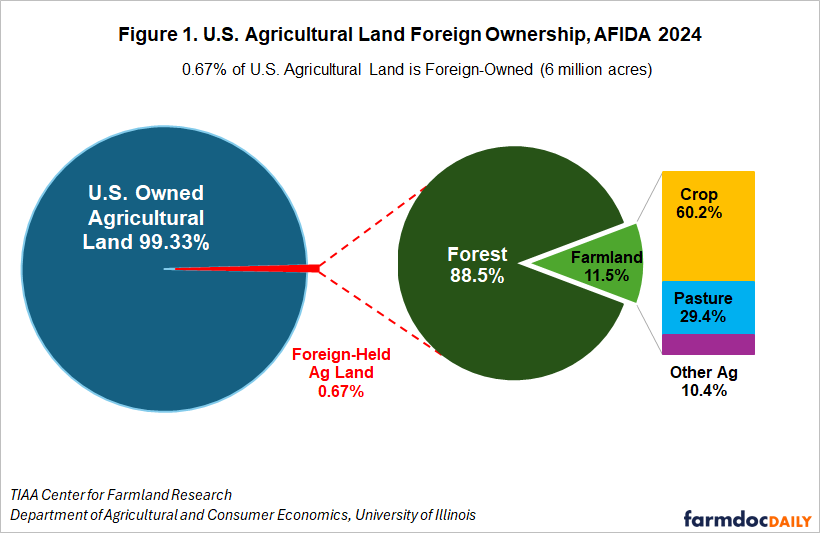
Figure 1 shows foreign ownership as a share of U.S. farmland. The left-hand pie chart shows all U.S. land in farms, with the denominator taken from the 2022 Census of Agriculture. Note that there are numerous options for considering the “share” of foreign ownership, and this choice can substantially affect the reported fractions with the same total foreign acre counts. Using US land in Farms as the reference, foreign ownership interests amount to 0.67 percent of the total, and the remaining 99.33 percent is US owned. References to published figures as high as 3.6 percent are difficult to reconstruct but are approximately the total that would occur if one included long-term leases and holdings, included land with no foreign ownership indicated as a share of privately held land, had a zero percent of current foreign ownership, or indicated no foreign country in the ownership codes. Note that both approaches are calculable, as they simply are tabulating different collections of data reported in AFIDA, but higher numbers may include land reported in the AFIDA system that most would not consider to be controlled by a foreign entity in a traditional sense. Moreover, many of the long-term leases cover the potential to develop a wind or solar project and do not materially affect the nature of the underlying land.
The right-hand split out from the pie chart shows the foreign-owned acres by land type. Forestland accounts for 88.5 percent while cropland, pasture, and other agricultural land account for 11.5 percent. Within the farmland subset, cropland is about 60 percent, pasture 29 percent, and other agricultural land 10 percent. Much of the foreign-owned forest is commercial timberland that the Census of Agriculture does not count as land in farms, so the 0.67 percent figure is best read as an upper bound. Measured against cropland, pasture, and other agricultural land only, direct foreign owners hold about 690,000 acres, or less than one-tenth of one percent of U.S. land in farms. Again, other tabulations including other types of ownership interests are also possible, but this treatment seems most aligned with realistic descriptions of crop production and other farmland uses.
Ownership by Country and Land Type
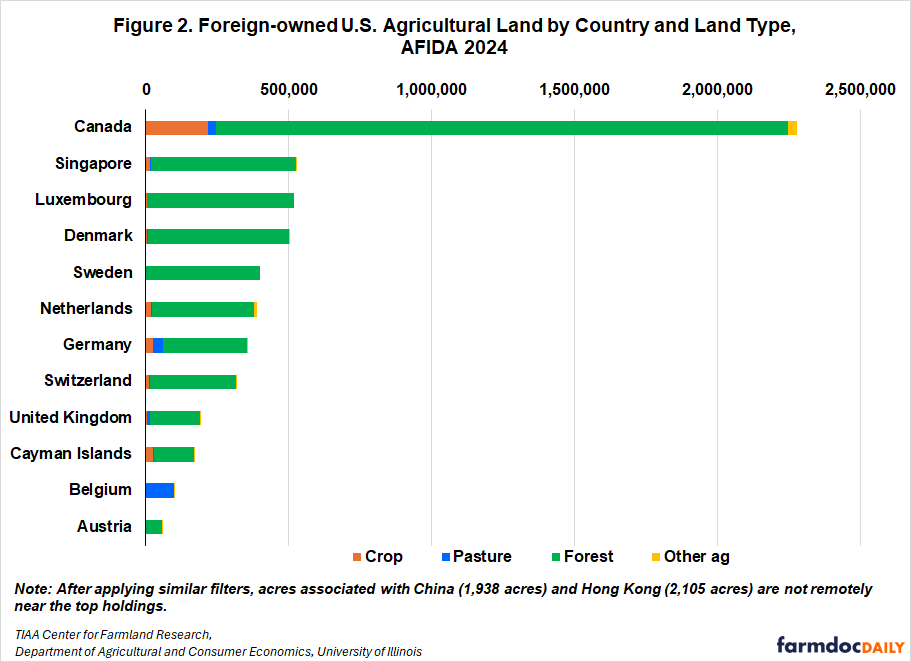
The countries with the largest ownership positions in U.S. agricultural land are Canada and several Western European nations with primary ownership in forestland. Canada is the largest at 2.28 million acres (38 percent), followed by Singapore, Luxembourg, Denmark, Sweden, the Netherlands, Germany, and Switzerland. Together these eight countries hold 88 percent of foreign-owned agricultural acres, again, largely within the forest land category. Of course, many US-based forest product companies also have holdings that span the northern border with Canada as well as contiguity of logging and milling operations makes sense in these industries. While holdings by Chinese interests are often the focus of political claims, total direct individual ownership attributed to China with full information about citizenship totals only 1,938 acres, placing it 31st among 49 countries. Including all records, 247,659 acres are attributable to Chinese interests including all affiliated entities, or about 0.5 percent of all reported foreign interests. Using either measure, it is difficult to reconcile claims about expansive ownership.
Figure 2 shows the composition of holdings by land type for the twelve countries with the most foreign-owned agricultural acres. Together they account for about 97 percent of the total. Forest accounts for 89 percent of foreign-owned agricultural acres (5.31 million acres), cropland for 7 percent (415,000 acres), pasture for 3 percent, and other agricultural land for 1 percent. Sweden, Luxembourg, Denmark, Austria, and Singapore hold almost entirely forest. Belgium’s holdings are mainly pasture. Canada and Germany have the largest cropland positions.
Where Foreign-Owned Land is Located
Texas has the most foreign-owned agricultural acres at 1.14 million acres, followed by Michigan (799,000 acres), Oregon (540,000 acres), Alabama (537,000 acres), and Maine (504,000 acres). These land mainly resides in the country’s commercial timber regions: the Gulf South, the Pacific Northwest, the Upper Great Lakes, and northern New England. Among the leaders, Montana is the only state where pasture predominates and California is the only state where cropland leads. For reference, Illinois has 25,847 foreign-owned agricultural acres, with 23,270 acres of cropland or about 0.1 percent of the state’s land in farms.
The state ranking across all acres reported in AFIDA differs because the mix of interest types that vary from state to state. In predominantly timber states, nearly everything reported is in direct ownership: 97 percent of Maine’s reported acres, 94 percent of Alabama’s, and 92 percent of Michigan’s are fee interests, whole or partial. In the Plains and Corn Belt the opposite holds with predominantly energy leases accounting for 96 percent of reported acres in Kansas, 89 percent in Oklahoma, 73 percent in Colorado, and 77 percent in Illinois.
Table 1 shows the fifteen states with the most reported AFIDA acres, plus Illinois, by ownership type. Nationally, corporations account for 26 percent of reported acres, partnerships for 13 percent, and individuals and trusts for under 1 percent each. The remaining 60 percent falls in USDA’s “Other” category. Within the “Other” category, about 81 percent of the acres are held by limited liability companies. The “Other” share is highest in the timber states, above 90 percent in Louisiana, South Carolina, Michigan, and Alabama, while corporations and partnerships hold larger shares in Texas, Oregon, Maine, and Washington. Individual foreign holders are a small share everywhere, at most 3 percent of acres in any state shown.
Table 1. Share of reported 2024 AFIDA acres by owner type, fifteen largest states and Illinois
| State | Total Agricultural Acres (after filters) | Corporation | Partnership | Individual | Trust | Other |
| Texas | 1,139,674 | 40.52% | 38.81% | 1.10% | 0.15% | 19.42% |
| Michigan | 799,363 | 7.21% | 0.00% | 0.03% | 0.00% | 92.77% |
| Oregon | 540,065 | 64.34% | 0.92% | 0.00% | 0.00% | 34.74% |
| Alabama | 537,125 | 8.28% | 0.45% | 0.00% | 0.00% | 91.28% |
| Maine | 504,230 | 54.59% | 25.51% | 0.00% | 0.00% | 19.91% |
| Arkansas | 440,544 | 6.25% | 6.23% | 0.01% | 0.00% | 87.51% |
| Mississippi | 359,253 | 19.38% | 0.14% | 0.00% | 0.00% | 80.48% |
| South Carolina | 270,285 | 0.00% | 7.07% | 0.00% | 0.00% | 92.93% |
| Washington | 250,798 | 54.72% | 0.57% | 0.22% | 0.00% | 44.49% |
| New York | 210,490 | 9.84% | 46.75% | 0.04% | 0.00% | 43.37% |
| Louisiana | 183,617 | 6.36% | 0.00% | 0.00% | 0.00% | 93.64% |
| Montana | 135,684 | 12.22% | 0.00% | 1.37% | 2.06% | 84.34% |
| California | 107,022 | 11.79% | 12.22% | 0.16% | 0.11% | 75.72% |
| Virginia | 79,724 | 35.97% | 23.22% | 1.15% | 0.00% | 39.67% |
| North Carolina | 73,881 | 19.65% | 0.00% | 0.03% | 0.00% | 80.32% |
| Illinois | 25,847 | 18.22% | 3.14% | 3.02% | 13.09% | 62.52% |
Source: AFIDA 2024 and TIAA Center for Farmland Research, University of Illinois.
Exploring the Data by County
State totals can mask considerable local variation. To help readers explore the ownership pattern more completely, the TIAA Center for Farmland Research at the University of Illinois developed an interactive map of foreign ownership interests by county for the 48 contiguous states, using the same data steps described in this article. It is available below as an interactive utility and at: https://farmdoc.illinois.edu/farmland-center/tools-data/foreign-agricultural-land-ownership-map.
In the map, a square inside each county indicates the share of the county’s total land area held by foreign owners. County land area comes from the Census Bureau’s TIGER/Line files and excludes water. Four measures can be displayed: all agricultural land, farmland only, forest only, and cropland only. A drop-down menu lets the user choose one country, such as Canada, so that the map shows only the land owned by investors from that country. The AFIDA total is often read as a measure of foreign ownership, but most of it is leases and unconfirmed records. Confirmed ownership amounts to well under one percent of U.S. farmland in our analysis.
There are many other potentially important implications embedded in the ongoing narratives about farmland ownership and related efforts to either restrict or encourage specific types of ownership. Pension funds (both US based and multi-national), charitable organizations, foundations, and Church-related entities hold substantial amounts of farmland and state-by-state differences in ownership restrictions can affect availability of investor capital in non-uniform ways across geo-political boundaries. Farmland is also treated somewhat differently than other real estate in many public discussions with implications that differ from say residential or commercial holdings in REITS or other forms with equity shares distributed among legal investors governed by securities laws. CFIUS (Committee on Foreign Investments in the US) and FIRPTA (Foreign Investment in Real Property Tax Act) and a range of other regulatory bodies also regulate foreign holdings or treatment of transactions of US based assets, but with substantially different reporting systems with potentially overlapping and/or inconsistent requirements. And finally, US citizens and invested interests nearly certainly have far more foreign holdings than foreign interests have in the US raising reciprocal response issues if treatment of currently legal ownership were substantially changed for reasons unsupported by empirical realities.
A future farmdoc daily article will separately treat long-term leases as reported in the AFIDA system and discuss the implications to renewable energy lease activities in particular.
References
National Agricultural Law Center. “Foreign Ownership of Agricultural Land: FAQs & Resource Library.” Last updated June 26, 2026. https://nationalaglawcenter.org/foreign-investments-in-ag/
USDA Farm Service Agency (USDA FSA). 2026. "Foreign Holdings of U.S. Agricultural Land Through December 31, 2024." Washington, DC, January 2026. Report 1, p. 17. https://www.fsa.usda.gov/sites/default/files/2026-01/AFIDAYR2024ReportWithPageNumbers.pdf
USDA Farm Service Agency. "USDA Launches New Online Portal for Reporting Foreign-Owned Agricultural Land Transactions." News release, January 22, 2026.
USDA Farm Service Agency. AFIDA current holdings data file, year 2024, and "Key to AFIDA Data Fields for 2016 and Forward Years," obtained under the Freedom of Information Act.
USDA National Agricultural Statistics Service. 2022 Census of Agriculture, land in farms (880,100,848 acres).
U.S. Census Bureau. TIGER/Line Shapefiles, county boundaries and land area.
Disclaimer: We request all readers, electronic media and others follow our citation guidelines when re-posting articles from farmdoc daily. Guidelines are available here. The farmdoc daily website falls under University of Illinois copyright and intellectual property rights. For a detailed statement, please see the University of Illinois Copyright Information and Policies here.