








Food Inflation and the Outlook for Beef Prices
The latest Consumer Price Index (CPI) report shows that overall prices increased 0.4% in August and 3.4% over the past year. Energy was an important contributor to the August increase. Gasoline prices rose 3.9% during the month and accounted for more than one-third of the increase in the all-items CPI. In comparison, prices excluding food and energy increased 2.4% over the past year (see Consumer Price Index Summary, BLS, September 11, 2026).
Today’s article examines recent food price trends, including differences between food purchased at home and away from home. We will then take a closer look at beef, where tight cattle supplies and strong consumer demand have contributed to elevated retail prices.
Food Prices at Home and Away
Overall, the food index increased 0.1% in August and 2.7% over the past 12 months. The CPI for food is divided into two subindices: food-at-home, which measures prices for food purchased at grocery stores and supermarkets, and food-away-from-home, which measures prices at restaurants and other food service establishments.
Food-at-home prices were unchanged in August but were 2.2% higher than a year ago. The 2.2% increase also masks differences across grocery categories. Over the past year, nonalcoholic beverage prices increased 3.7%, fruits and vegetables increased 3.2%, cereals and bakery products increased 2.6%, and other food at home increased 2.4%. Prices for meats, poultry, fish, and eggs increased only 1.1% as increases in some products were offset by declines in others. Notably, beef and veal prices increased 5.9% and fish and seafood prices increased 6.5%, while egg prices declined 23.0%. Poultry prices increased a more modest 0.5%, while dairy and related product prices were 0.3% lower than a year ago.
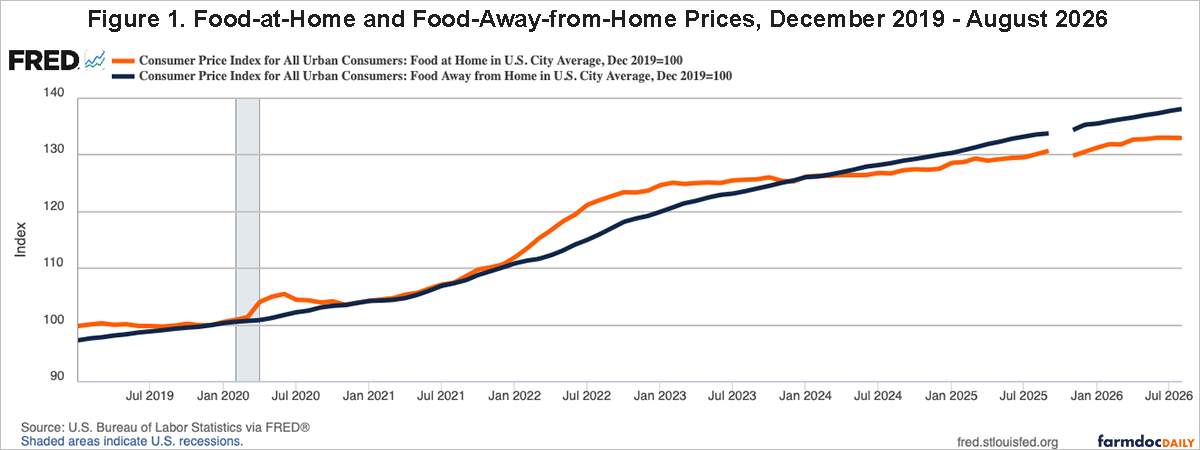
Food-away-from-home prices have continued to rise faster than food-at-home prices throughout 2026. In August, the food-away-from-home index increased 0.3% and was 3.4% higher than a year ago, compared with a 2.2% year-over-year increase in food-at-home prices. This difference is also evident over a longer period. As shown in Figure 1, food-at-home prices have increased 33.0% since December 2019, while food-away-from-home prices have increased 38.1%.
The USDA’s September 2026 Food Price Outlook forecasts that average food-at-home prices will increase 2.4% in 2026 and 1.8% in 2027, while food-away-from-home prices are projected to increase 3.5% and 2.6%, respectively (see Food Price Outlook, USDA Economic Research Service, September 25, 2026). The outlook also varies considerably across food categories. For 2026, USDA forecasts lower egg prices and relatively modest increases for pork, poultry, and dairy products, while beef and veal prices are projected to increase 9.4%.
Beef Prices and Cattle Inventory
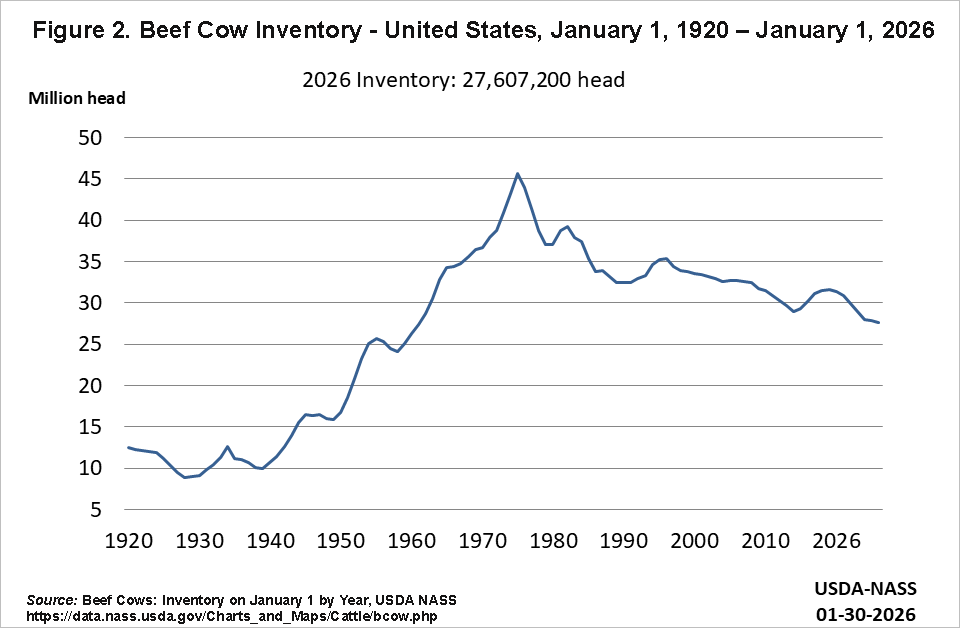
Tight inventory remains an important factor behind elevated beef prices. USDA estimated 28.5 million beef cows on U.S. farms as of July 1, 2026, down 1% from a year earlier. Beef replacement heifers increased 3% to 3.8 million head, while the 2026 calf crop is expected to total 32.5 million head, down 2% from last year (see Cattle, USDA NASS, July 24, 2026).
The beef cow herd also remains historically small. As shown in Figure 2, inventories have declined substantially from earlier cattle-cycle peaks and remain near levels last observed several decades ago.
Rebuilding the cattle herd takes time. Producers must retain more heifers for breeding rather than market them, which can further limit beef supplies in the near term. The Federal Reserve Bank of Kansas City reported that high replacement costs, drought, and other production risks could slow herd rebuilding. Historically, total cattle inventories have tended to expand only after producers have retained replacement heifers for two to three years (see High Costs and Uncertainty Will Likely Keep Cattle Inventories Low and Beef Prices Elevated for Some Time, Federal Reserve Bank of Kansas City, August 5, 2026).
Strong consumer demand has also supported domestic beef prices as U.S. beef consumption in 2026 is about 8% above its 20-year average, while domestic production remains below its historical average (see High Costs and Uncertainty Will Likely Keep Cattle Inventories Low and Beef Prices Elevated for Some Time, Federal Reserve Bank of Kansas City, August 5, 2026). Additionally, domestic meat demand indices also indicate that retail beef demand remained above year-earlier levels during the summer. In July, Choice beef demand was 3.46% higher than a year earlier, while all-fresh beef demand was 4.06% higher (see Recent Domestic Demand Indices, Meat Demand).
Summary
The August 2026 CPI data show that food prices were 2.7% higher than a year earlier. Food-at-home prices rose 2.2%, while food-away-from-home prices increased 3.4%. Within the food-at-home index, however, price changes varied considerably across categories. Some products recorded only modest increases or declines, while others, including beef and veal and fish and seafood, experienced much larger gains.
For example, beef and veal prices were 5.9% higher in August than a year earlier, extending a period of elevated beef prices that has persisted for several years. These higher prices reflect conditions specific to the cattle market. Beef cow inventories remain historically low, the 2026 calf crop is smaller than last year, and rebuilding the herd will take time. At the same time, consumer demand for beef has remained strong. Together, tight supplies and resilient demand have helped keep beef prices elevated even as inflation across the broader food-at-home category has remained more moderate.
References
Bureau of Labor Statistics. “Consumer Price Index News Release.” U.S. Department of Labor, September 11, 2026.
Economic Research Service. “Food Price Outlook: Summary Findings.” U.S. Department of Agriculture, updated September 25, 2026.
Scott, Francisco. 2026. “High Costs and Uncertainty Will Likely Keep Cattle Inventories Low and Beef Prices Elevated for Some Time.” Federal Reserve Bank of Kansas City, Economic Bulletin, August 5.
Tonsor, Glynn. September 16, 2026. “Recent Domestic Demand Indices.” AgManager.info. Kansas State University.
National Agricultural Statistics Service. “Cattle.” U.S. Department of Agriculture, July 24, 2026.
U.S. Bureau of Labor Statistics, Consumer Price Index for All Urban Consumers: Food at Home in U.S. City Average [CUUR0000SAF11], retrieved from FRED, Federal Reserve Bank of St. Louis; https://fred.stlouisfed.org/series/CUUR0000SAF11.
U.S. Bureau of Labor Statistics, Consumer Price Index for All Urban Consumers: Food Away from Home in U.S. City Average [CUUR0000SEFV], retrieved from FRED, Federal Reserve Bank of St. Louis; https://fred.stlouisfed.org/series/CUUR0000SEFV.
Disclaimer: We request all readers, electronic media and others follow our citation guidelines when re-posting articles from farmdoc daily. Guidelines are available here. The farmdoc daily website falls under University of Illinois copyright and intellectual property rights. For a detailed statement, please see the University of Illinois Copyright Information and Policies here.