








Liquidity and Repayment Capacity
Previous articles have examined differences in crop machinery investment, crop machinery costs, and labor standards for different sized crop farms (Langemeier, 2025a; Langemeier, 2025b; Langemeier, 2026). This article examines trends in current ratios and repayment capacity for crop farms using FINBIN data from 2007 to 2025. Crop farms are broken down into four farm size categories: less than 500 crop acres, 500 to 1000 crop acres, 1000 to 2000 crops acres, and greater than 2000 crop acres. Comparisons will focus on farms with less than 500 crop acres and farms with more than 2000 crop acres.
Trends in the Current Ratio
The current ratio is commonly used to measure a farm’s liquidity position. The current ratio is computed by dividing current assets by current liabilities. Current assets include cash, accounts receivable, supply inventories, crop inventories, and market livestock inventories. Current liabilities include accounts payable, operating lines of credit, and the portion of non-current loans due within the next year. Liquidity thresholds are typically used by analysts to determine whether a farm has an adequate liquidity position. A current ratio above 2.0 is considered adequate. A farm with a current ratio below 1.0 cannot cover their current liabilities by selling all their current assets.
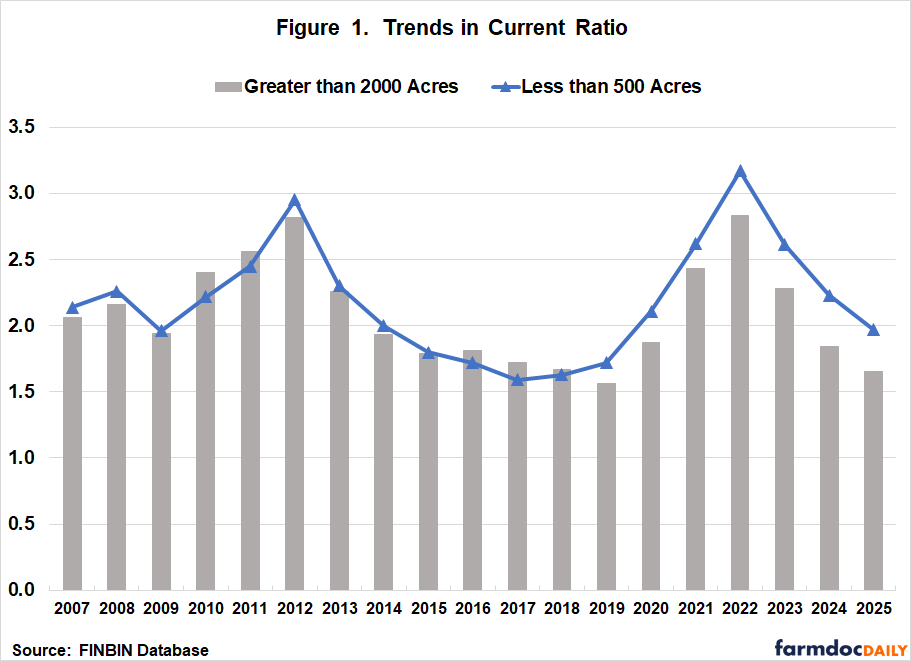
Average current ratios for the 2007 to 2025 period for each farm size category were as follows: 2.18 for farms with less than 500 crop acres; 2.23 for farms with 500 to 1000 crop acres; 2.14 for farms with 1000 to 2000 crop acres; and 2.08 for farms with more than 2000 crop acres. With the exception being farms with 500 to 1000 crop acres, each farm size category had a current ratio below 2.0 in 2025.
Figure 1 illustrates the trend in the current ratio for the smallest and largest farm size categories. The average difference in the current ratio over the 2007 to 2025 period was 0.10, with the smaller farms having a higher average current ratio. The average current ratio for the smaller farms was below 2.0 in 2009, from 2015 to 2019, and in 2025. In addition to these years, the average current ratio for the larger farms was below 2.0 in 2014, 2020, and 2024. A simple linear trend of the difference between the current ratio between the two farm size groups was used to determine whether the difference in rates was converging or diverging. Results indicated that the difference in the average current ratio between the two farm size groups was diverging or becoming larger over time.
Trends in Repayment Capacity
Repayment capacity is typically measured using the capital debt repayment margin and the replacement margin. The capital debt repayment margin is computed by subtracting owner withdrawals (e.g., family living expenses; income and self-employment taxes) and principal on term debt and capital leases from the summation of accrual net farm income, off-farm income, and depreciation. A positive margin indicates that the farm has enough funds to cover owner withdrawals and principal payments on term debt. The replacement margin is computed by subtracting cash used for capital replacement (e.g., down payments on machinery and equipment) from the capital debt repayment margin. This measure helps evaluate whether a farm has enough funds to cover owner withdrawals, term debt payments, and replace assets. The replacement margin coverage ratio is computed by dividing capital debt repayment capacity by the sum of principal and interest payments on term debt, unpaid operating debt from prior periods, and cash used for capital replacement. If a farm has replacement margin coverage ratio greater than one, the farm has sufficient funds to cover owner withdrawals and term debt payments and replace assets. For an example of computations of repayment capacity see Langemeier (2020).
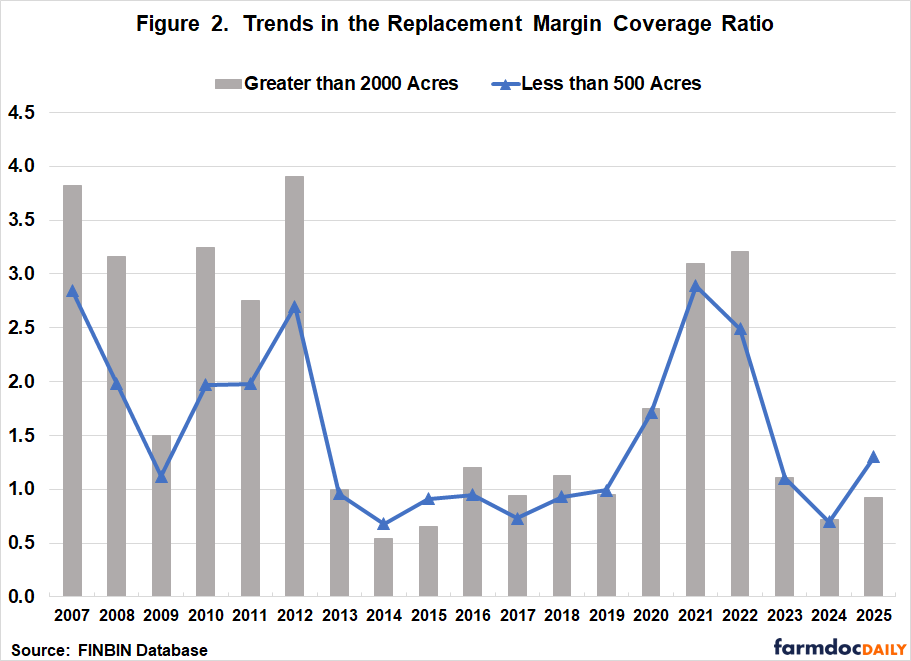
Average replacement margin coverage ratios for the 2007 to 2025 period for each farm size were as follows: 1.52 for farms with less than 500 crop acres; 1.60 for farms with 500 to 1000 crop acres; 1.66 for farms with 1000 to 2000 crop acres; and 1.87 for farms with more than 2000 crop acres. In 2025, the largest farms had a replacement margin coverage ratio below 1.0.
Trends in the replacement margin coverage ratio for the smallest and largest farm size categories are presented in Figure 2. The average difference in the replacement margin coverage ratio over the 2007 to 2025 period was 0.35, with the larger farms having a higher average ratio. In good years (e.g., 2007 to 2012 period and 2021 to 2022 period), the replacement margin coverage ratio for the large farms was quite a bit higher than the ratio for small farms. This larger ratio enables large farms to more readily purchase assets during high income years. The average replacement margin coverage ratio for the larger farms was below 1.0 in 2014, 2015, 2017, 2019, 2024, and 2025. In addition to these years, except for 2025, the average ratio for the smaller farms was below 1.0 in 2013, 2016, and 2018. Note that the replacement margin coverage ratio for the small farms was below 1.0 from 2013 to 2019. A simple linear trend of the difference between the replacement margin coverage ratio between the two farm size groups was used to determine whether the difference in rates was converging or diverging. Results indicated that the difference in the average replacement margin coverage ratio between the two farm size groups was converging or becoming smaller over time.
Summary
This article examines trends in current ratios and repayment capacity for crop farms using FINBIN data from 2007 to 2025. Comparing the smallest and largest farm size categories, small farms tend to have a stronger liquidity position but lower repayment capacity measures. The lower repayment capacity measures experienced by smaller farms makes it more difficult to replace assets in a timely fashion. Future articles will explore differences in financial performance as well as labor and machinery benchmarks between farms.
References
Center for Farm Financial Management, University of Minnesota, FINBIN web site, accessed July 8, 2026. https://finbin.umn.edu/
Langemeier, M. “Measuring Repayment Capacity and Farm Growth Potential.” Center for Commercial Agriculture, Purdue University, September 2020. https://ag.purdue.edu/commercialag/home/sub-articles/2020/09/measuring-repayment-capacity-and-farm-growth-potential/
Langemeier, M. "Crop Machinery Costs." farmdoc daily (15):224, Department of Agricultural and Consumer Economics, University of Illinois at Urbana-Champaign, December 5, 2025a.
Langemeier, M. "Crop Machinery Investment." farmdoc daily (15):233, Department of Agricultural and Consumer Economics, University of Illinois at Urbana-Champaign, December 18, 2025b.
Langemeier, M. "Labor Standards." farmdoc daily (16):1, Department of Agricultural and Consumer Economics, University of Illinois at Urbana-Champaign, January 2, 2026.
Disclaimer: We request all readers, electronic media and others follow our citation guidelines when re-posting articles from farmdoc daily. Guidelines are available here. The farmdoc daily website falls under University of Illinois copyright and intellectual property rights. For a detailed statement, please see the University of Illinois Copyright Information and Policies here.