


Estimated National 2014 ARC-CO and PLC Payments
We estimate 2014 payments by the ARC-CO and PLC crop programs, excluding generic base acres. We use program parameters in the 2014 farm bill, the 2014 farm bill program choices made by farmers, available county yields for 2014 crop year, and current estimates of 2014 crop year prices. Total ARC-CO and PLC payments are estimated to be $5.7 billion, but these estimates could change, as information is not final. It is not clear whether these payments would be less had the 2008 farm bill continued into 2014.
Background
The 2014 farm bill introduced three new crop payment programs: Agricultural Risk Coverage – county revenue option (ARC-CO), Price Loss Coverage (PLC), and ARC at the individual farm level (ARC-IC). ARC-CO replaced ACRE (Average Crop Revenue Program), PLC replaced CP (Counter-Cyclical Program), and ARC-IC can be viewed as a replacement for SURE (Supplemental Revenue Assistance).
Farm Service Agency (FSA) recently released signup data for the new programs. This included base acres by crop and county (see farmdoc daily June 16, 2015). Base acres are crucial because payments are made on 85% of base acres. Base acres are summarized in the next section. Then national estimates of ARC-CO and PLC payments are presented.
Base Acres
FSA reported a total base of 259.9 million acres (see Table 1). Corn had the most, 96.8 million acres representing 37% of total base acres. The next three largest crops were wheat, 63.7 million base acres or 25% of the total; soybeans, 54.5 million or 21%; and former cotton base acres which are now called generic acres, 17.6 million or 7%. These four categories account for 90% of total base acres. Their large acreages mean they have a large impact on total program payments.

Base acres elected into ARC-CO, PLC, and ARC-IC are 185.1 million, 55.1 million, and 2.1 million, respectively. They are 71%, 21%, and less than 1% of total base acres. Due to its larger number of base acres, ARC-CO usually will have a higher impact on total program payments than PLC or ARC-IC.
Estimated 2014 ARC-CO payments
ARC-CO payments were estimated for each major producing county by crop. This required use of 2014 crop year yields by county, 2014 crop year average prices, and base acres by county. County crop year yields are from the USDA, National Agricultural Statistical Service (NASS) because Farm Service Agency (FSA) has not yet released their estimates, which may differ from those of NASS. Crop year average prices are the midpoint of World Agricultural Supply and Demand Estimates (WASDE) ranges for those crops reported by WASDE. Projected 2014 prices for crops not reported in WASDE were obtained from the FSA website. Estimated county payments were aggregated to national payments by crop using estimated shares of base acres by county as FSA has not released base acres by county. Resulting estimated payments are shown in Table 2.
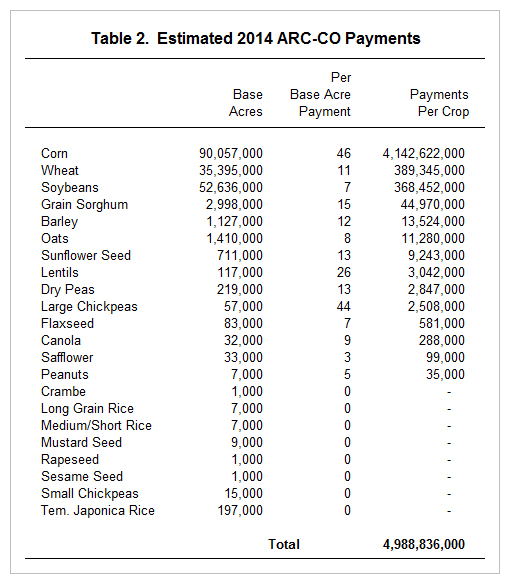
On a per base acre basis for the U.S. as a whole, estimated payments are largest for corn at $46 per acre, followed by large chickpeas ($44 per base acre), lentils ($26), grain sorghum ($15), and dry peas ($13). Note that these are national payments. They will vary by county, sometimes notably, due to variation in yields across counties (see farmdoc daily February 24, 2015 for county estimates).
Overall, 2014 ARC-CO payments are estimated at $5.0 billion. Because of its large base acres and large payment per base acre, corn accounts for 83% of total payments.
Estimated 2014 PLC Payments
PLC payments are estimated with the same estimated 2014 crop year prices as used to estimate ARC-CO payments. A national, average payment yield is estimated based on data released by FSA. Estimated per base acre payments are obtained by multiplying estimated 2014 payment rates times estimated 2014 payment yield times the 85% payment factor. All these values are presented in Table 3.
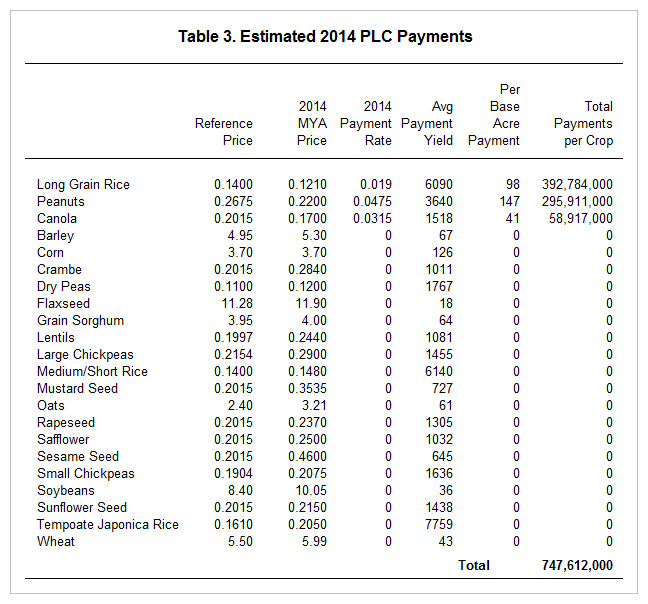
Total PLC payments are estimated at $748 million. In 2014, long-grain rice, peanuts, and canola are projected to have payments of $393 million, $296 million, and $59 million, respectively. Peanuts have the largest per base acre payment across ARC-CO and PLC ($147 per base acre).
ARC-IC and Generic Program Payments
Estimates are not provided for these programs due to concerns over the reasonable validity of any estimate. Estimates for ARC-IC need farm level data, which is not available. Estimates for generic base acres requires knowing what crops farmers decided to plant on their former cotton base acres since planting decisions determine which crop will be used to determine payments. We simply felt that too much of this important information is not known to generate any reasonable estimate of potential cost.
While difficult to estimate, ARC-IC likely will not have large impacts on total commodity program costs. ARC-IC has 2.1 million base acres, less than 1% of total base acres. Generic base acres are 17.6 million base acres, representing 7% of base acres. Payments on generic base acres could impact total payments.
Summary and Commentary
It is important to underscore that the estimated payments by ARC-CO and PLC could change as crop year prices are finalized and as FSA releases final program values. It also is important to keep in mind that we feel insufficient information exist to estimate payments for ARC-IC and generic base acres (former cotton base acres). The former accounts for less than 1% and the latter 7% of total U.S. base acres.
Given these important caveats, we estimate total ARC-CO and PLC payments for the 2014 crop year to be $5.7 billion, with ARC-CO accounting for 87%. Not unexpectedly given that these are risk assistance programs, payments are concentrated, with corn accounting for 83% of estimated ARC-CO payments and long-grain rice and peanuts accounting for 53% and 40% of PLC payments.
A question of interest is: Are these large payments? As with many policy questions, the answer depends on one’s perspective. At the time that the 2014 farm bill was passed, the Congressional Budget Office (CBO) estimated the new programs would cost less than extending the 2008 farm bill programs. The later includes direct payments eliminated by the 2014 farm bill. However, 2014 is now closer to an actual year than a forecast year. Thus, there is a need to estimate payments for the 2014 crop year under the 2008 farm bill programs to understand if the 2014 farm bill lowered commodity payments. A key estimate is for ACRE. Election into ACRE likely would have been open for the 2014 crop year, and it is likely ACRE would have made substantial payments in 2014 given the sharp decline in crop prices. Even after subtracting the 20% reduction in direct payments required if ACRE was elected, direct payments would have exceeded $3.5 billion. In short, it is not clear 2014 farm bill payments will exceed 2008 farm bill payments for the 2014 crop year.
Over the 2009-2012 crop years, direct, SURE, ACRE, and CP payments averaged around $5.9 billion per year. It is not clear that 2014 farm bill program payments for the 2014 crop year will exceed the actual average payments of the 2008 farm bill.
Last, projected 2014 program payments are not as large as highs occurring in previous years when prices decreased. Based on data from the USDA Farm Service Agency, total spending on price support programs, including forfeitures to the Commodity Credit Corporation averaged $15.4 billion per year from the 1985 to 1988 fiscal years. These were years during the peak of the 1980 financial crisis. During the last period of major, prolonged price decline in the late 1990s and early 2000s, price support payments plus fixed payments plus ad hoc market loss and oilseed payments to farmers averaged $15.7 billion over fiscal years 1998 through 2002.
Obviously, 2014 is only the first year of the current farm bill. Readers can draw their own conclusion regarding the size of expenditures, but it is not clear that 2014 farm bill expenditures for the 2014 crop year are large relative to recent expenditures on crop programs.
References
Schnitkey, G. "Estimated 2014 ARC-CO and PLC Payments." farmdoc daily (5):34, Department of Agricultural and Consumer Economics, University of Illinois at Urbana-Champaign, February 24, 2015.
Schnitkey, G., J. Coppess, N. Paulson, and C. Zulauf. "Perspectives on Commodity Program Choices under the 2014 Farm Bill." farmdoc daily (5):111, Department of Agricultural and Consumer Economics, University of Illinois at Urbana-Champaign, June 16, 2015.
Disclaimer: We request all readers, electronic media and others follow our citation guidelines when re-posting articles from farmdoc daily. Guidelines are available here. The farmdoc daily website falls under University of Illinois copyright and intellectual property rights. For a detailed statement, please see the University of Illinois Copyright Information and Policies here.