


2016 Harvest Prices and High Yields Imply Low Crop Insurance Payments in Illinois
Harvest prices used to determine crop insurance payments for corn and soybeans policies in Midwest states are based on settlement prices of Chicago Mercantile Exchange (CME) during the month of October. October has come to an end, and 2016 harvest prices are known. The 2016 harvest price for corn is $3.49 per bushel, 10% lower than the $3.86 projected price. The soybean harvest price is $9.75 per bushel, 10% higher than the $8.85 projected price.
Break-even Yields for 2016
Table 1 shows multipliers for use in calculating yields below which Revenue Protection (RP) will make payments. Take the yield multiplier times the guarantee yield to arrive at a break-even yield. As an example, suppose the guarantee yield is 190 bushels per acre, and the selected coverage level is 85%. The multiplier in this case .94 (see Table 1) leading to a break-even yield is 179 bushels per acre (190 guarantee yield x .94 multiplier), and RP will make payments when yields are below 179 bushels per acre.
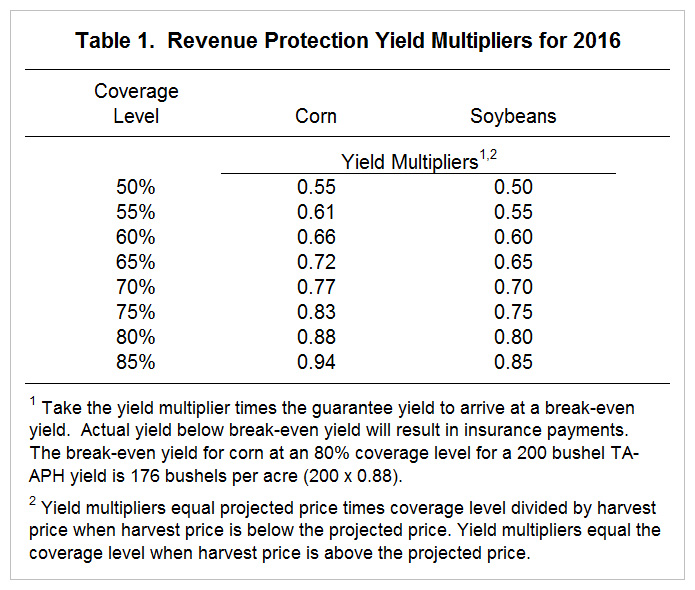
Note that the multipliers for soybeans are the same as the coverage level. For example, the 85% coverage level has a .85 multiplier. The 2016 harvest price is above the 2016 projected price, causing the revenue guarantee to reset using the higher harvest price. In these cases, a yield loss at least as large as the deductible – one minus the coverage level – must occur before an insurance payment occurs.
Projected 2016 Loss Ratios
Harvest prices, along with yield estimates from USDA, provide indications of possible loss ratios in 2016. A loss ratio equals insurance payments divided by total premiums. Loss ratios below 1.0 mean that payments are less than premiums.
Table 2 shows loss ratios for corn and soybeans in Illinois, along with projected and harvest prices, for years from 2005 to 2015. For corn, loss ratios range from a low of .10 in 2006 and 2007 to a high of 6.14 in 2012, the drought year. State yields in 2016 likely will be very similar to 2014. The state yield for corn in Illinois was 200 bushels per acre, while the state yield for 2016 is projected at 202 bushels per acre. In 2014, the loss ratio was .48, toward the lower end of the 2005-16 distribution. In 2014, the harvest price was 24% below the harvest price. The 2016 harvest price is only 10% below the harvest price. Relative to 2014, yield losses must be larger in 2016 to trigger insurance payments, which should lead to fewer payments in 2016. Overall, the 2016 loss ratio in Illinois likely will be well below .50.
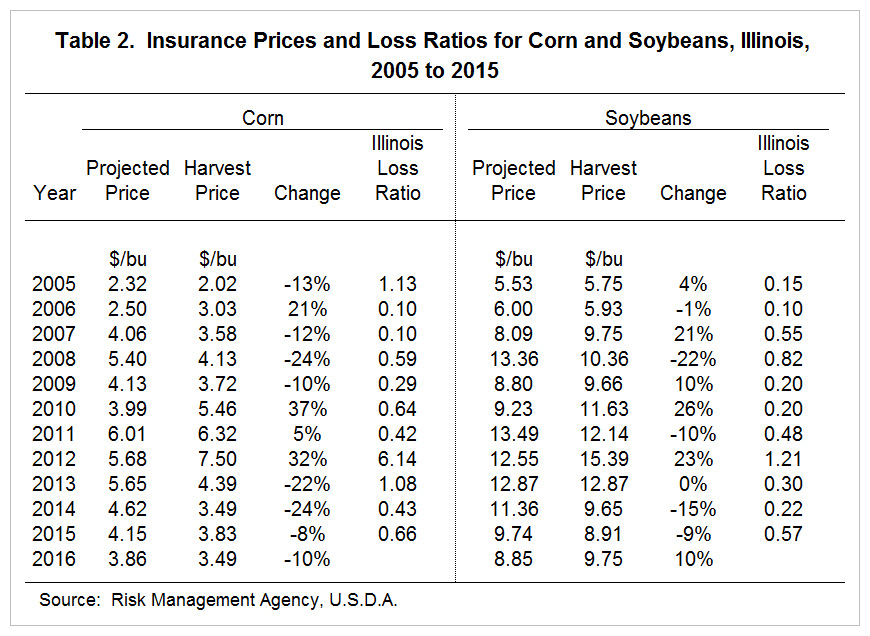
For soybeans, loss ratios ranged from a low of .10 in 2006 to a high of 1.21 in 2012. Record soybean yields are projected for 2016 (see farmdoc daily October 25, 2016). Record soybean yields occurred in 2015 as well when the soybean loss ratio was .57. The 2016 loss ratio likely will be less than .57 because yield losses must be larger in 2016 than in 2015 before insurance payments occur. A loss ratio below .50 is likely for soybeans in 2016.
Summary
The release of harvest prices allows assessment of crop insurance payments for 2016. High yields in Illinois lead to expectations of low crop insurance payments. Over much of the Midwest, relatively high corn and soybean yields should result in low crop insurance losses, with the possible exception of Indiana and Ohio in the eastern corn-belt. In these areas, yields were less favorable than in most areas in the central and western corn-belt.
References
Schnitkey, G. "Soybean Yields in Illinois." farmdoc daily (6):201, Department of Agricultural and Consumer Economics, University of Illinois at Urbana-Champaign, October 25, 2016.
Disclaimer: We request all readers, electronic media and others follow our citation guidelines when re-posting articles from farmdoc daily. Guidelines are available here. The farmdoc daily website falls under University of Illinois copyright and intellectual property rights. For a detailed statement, please see the University of Illinois Copyright Information and Policies here.