


Illinois County Soybean Yields: Highest Above-Trend Yields Centered in South-Central and Southern Illinois
Several farmdoc daily articles have documented the exceptional corn and soybean yields occurring in Illinois and the Corn Belt since the 2012 drought (e.g., farmdoc daily, September 5, 2018; December 11, 2018; January 3, 2019; April 9, 2019). In this article, county soybean yields for Illinois are examined using yield deviations. As described in the next section, yield deviations are the difference between actual yields and trend yields. The period from 2014 to 2018 represents an unusual historical period in the widespread nature of above-trend yields in Illinois. Moreover, the amount above-trend is unusual. While all areas of Illinois had above-trend yields, the center of the very high yields is in south-central and southern Illinois.
Calculations to Yield Deviations
County yields for Illinois were obtained from Quick Stats, a website maintained by the National Agricultural Statistical Service (NASS), an agency of the U.S. Department of Agriculture. Data were obtained for all Illinois counties for the years from 1954 to 2018.
Figure 1 shows the actual yields for Piatt County, Illinois. Also shown in Figure 1 are trend yields from 1984 to 2018. A given year’s trend yield is based on the thirty previous yields. For example, yields from 1954 to 1983 were used to calculate the 1984 trend yield. For 1984, a straight line was fit through the 1954 to 1983 yields using linear regression. The linear line was then extended one year in the future to arrive at the 1984 trend yield. Similar procedures were used for all years from 1985 to 2018.
The trend yield gives an estimate of the center of yield distribution for the respective year. The trend yield for Piatt County in 2018 is 66.2 bushels per acre (see Figure 1). If 2018 could be repeated many times, the average of those repeated yields would be close to the 66.2 trend yield. For Piatt County, recent trend yields are 56.8 in 2012, 56.9 in 2013, 57.2 in 2014, 58.8 in 2015, 61.9 in 2016, 64.3 in 2017, and 66.2 in 2018. Because of recent high yields, statistical procedures result in trend yields increasing at faster than a linear rate.
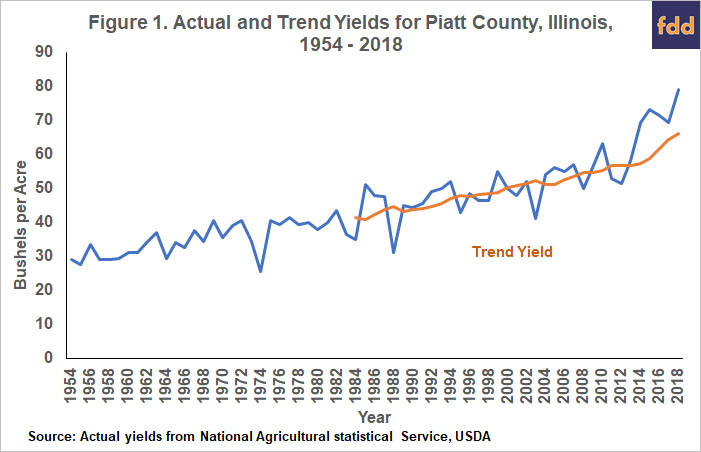
A yield deviation then equals the actual yield minus trend yield. A positive value indicates that the actual yield is above the trend yield. Relatively large positive deviations are associated with good yielding years. A negative value indicates that actual yield is below the trend yield. Below-trend years are poor yielding years. Yield deviations in recent years are:
2012: -5.4 = (51.4 actual yield – 56.8 trend yield)
2013: 1.3 = (58.2 actual yield – 56.9 trend yield)
2014: 12.1 = (69.3 actual yield – 57.2 trend yield)
2015: 14.3 = (73.1 actual yield – 58.8 trend yield)
2016: 9.4 = (71.3 actual yield – 61.9 trend yield)
2017: 5.1 = (69.4 actual yield – 64.3 trend yield)
2018: 13.0 = (79.2 actual yield – 66.2 trend yield)
A negative deviation of -5.4 bushels per acre occurred in 2012, the drought year. Since 2012, yield deviations have been positive in all years. Yield deviations have been particularly large since 2014, averaging 10.8 bushels per acre for the years from 2014 to 2018.
Yield Deviations
The percentage of counties with positive yield deviations were calculated for each year from 1984 through 2018 (see Figure 2). In 2018, for example, 98% of the counties had positive yield deviations.
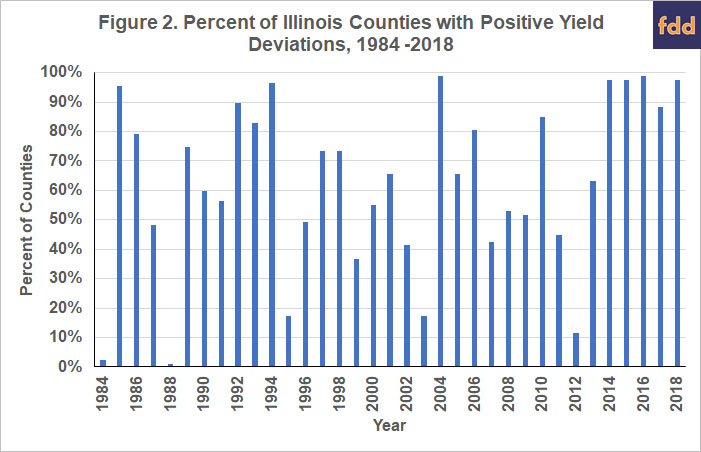
The last time less than 50% of the counties had below trend yields was in 2012, the drought year when only 11% of Illinois counties had positive yield deviations.
Since 2012, the vast majority of counties had yields above trend: 98% in 2014, 98% in 2015, 99% in 2016, 89% in 2017, and 98% in 2018 (see Figure 2). In four of the last five years, over 90% of the counties had positive yield trend. Only three times in the 29 years from 1984 to 2012 did the percentage of counties with positive yield deviations exceed 90%: 1985, 1994, and 2004 (see Figure 2). In the past five years, there has been a remarkable run in which the vast majority of counties had above-trend yields.
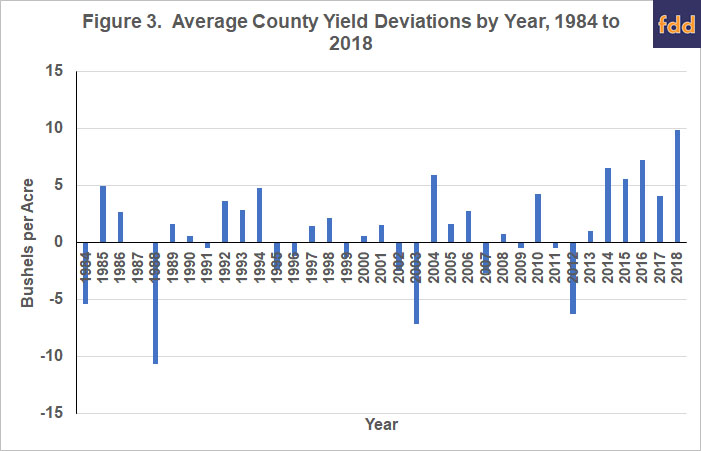
Besides having widespread good yields, the last five years also had yields well above-trend. Illinois counties averaged 6.5 bushels per acre above trend in 2014, 5.6 in 2015, 7.2 in 2016, 4.1 in 2017, and 9.9 in 2018 (see Figure 3). Between 2014 and 2018, county yield deviations averaged over 5 bushels per acre in 4 out of 5 years. Only one other year from 1984 to 2013 had an average yield deviation over 5 bushels per acre: 2004.
Spatial Pattern of High Yields in Illinois from 2014 to 2018
Overall, yield deviations point to widespread exceptional yields in Illinois. While all Illinois counties had yield deviations that averaged positive, there was a geographical area in central to southern Illinois that had exceptionally high yields (see Figure 4). From 2014 to 2018, ten counties had average yearly yield deviations over 10 bushels per acre. All of these counties were in south-central and southern Illinois counties (see Figure 4). Many other central and south counties had average yearly yield deviations over 8 bushels per acre.
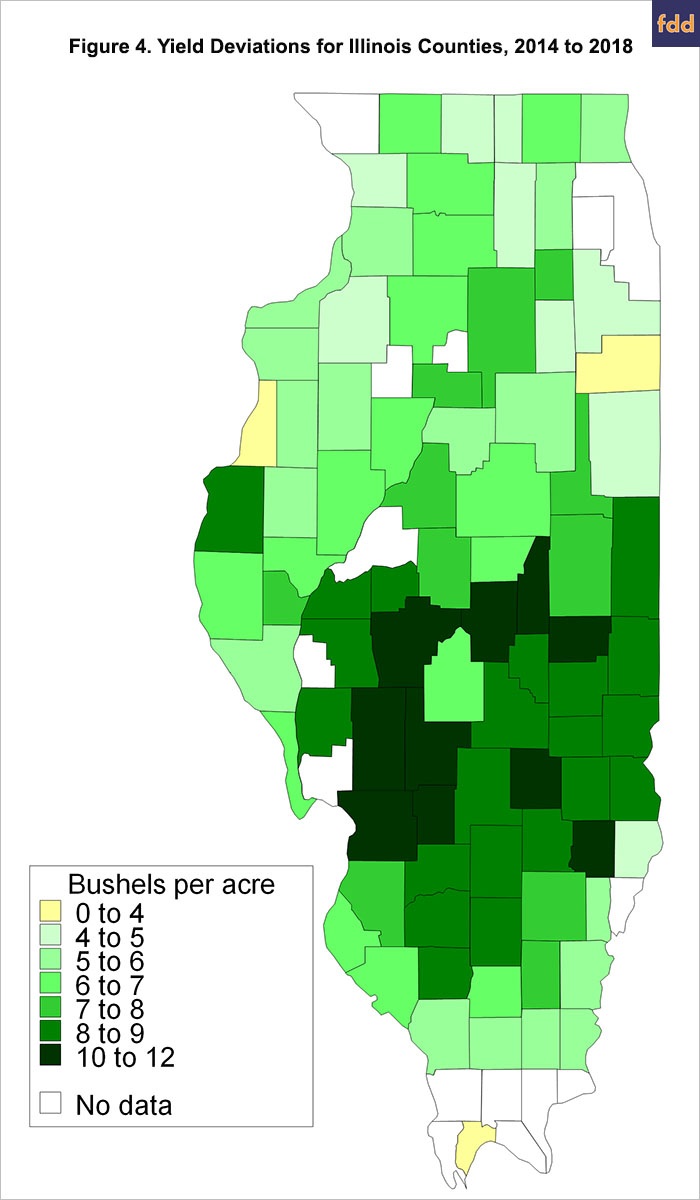
Conversely, counties in northern and north-central Illinois had lower, positive yield deviations. From 2014 to 2018, counties in this area of the state averaged yield deviations between 4 to 8 bushels per acre.
Summary
Soybean yields from 2014 to 2018 have been exceptional in Illinois both because of the widespread nature of above trend yields and because of the magnitude of above-trend yields. The highest above-trend yields tend to be centered in south-central and southern Illinois.
References
Schnitkey, G. "2018 County Corn and Soybean Yields: Exceptional Yields in Central Illinois and the Eastern United States." farmdoc daily (9):63, Department of Agricultural and Consumer Economics, University of Illinois at Urbana-Champaign, April 9, 2019.
Schnitkey, G. "The Geography of High Corn Yields." farmdoc daily (9):2, Department of Agricultural and Consumer Economics, University of Illinois at Urbana-Champaign, January 3, 2019.
Schnitkey, G. "The Geography of Exceptional Soybean Yields." farmdoc daily (8):226, Department of Agricultural and Consumer Economics, University of Illinois at Urbana-Champaign, December 11, 2018.
Schnitkey, G. "Exceptional 2018 Corn and Soybean Yields and Budgeting for 2019." farmdoc daily (8):165, Department of Agricultural and Consumer Economics, University of Illinois at Urbana-Champaign, September 5, 2018.
USDA/NASS. Quick Stats. https://quickstats.nass.usda.gov/
Disclaimer: We request all readers, electronic media and others follow our citation guidelines when re-posting articles from farmdoc daily. Guidelines are available here. The farmdoc daily website falls under University of Illinois copyright and intellectual property rights. For a detailed statement, please see the University of Illinois Copyright Information and Policies here.