


Marketing Corn, Soybeans, and Wheat in the New Era
In posts on March 29, April 5, April 12, and April 19 we examined crop and livestock price behavior in the new era that began to emerge in fall 2006. We argued that unfolding evidence suggested that corn, soybean, and wheat prices were indeed likely establishing a higher (nominal) average than previously experienced. Not surprisingly, the range of prices we forecast for this new era was also very wide. The purpose of this post is to take a more detailed look at the distribution of corn, soybean, and wheat prices we expect in this new era.
To develop expected distributions of prices we started with the percentage deviations of monthly farm prices received in Illinois from the average price in the previous era. For example, the average (nominal) price of corn in the previous era (January 1973-September 2006) was $2.42 and the price in January 1981 was $3.20, or 32% higher than the average for the era. The average price for the new era to date (January 2007-October 2011) is $4.32. We can then state an equivalent percentage deviation to the January 1981 price for the new era as 4.32 X 1.32 = 5.70. In other words $5.70 represents the equivalent 32% deviation above the average price for the new era as $3.20 does for the previous era. We did this same calculation for every month over January 1973-September 2006 to simulate the variability of prices we expect in the new era.

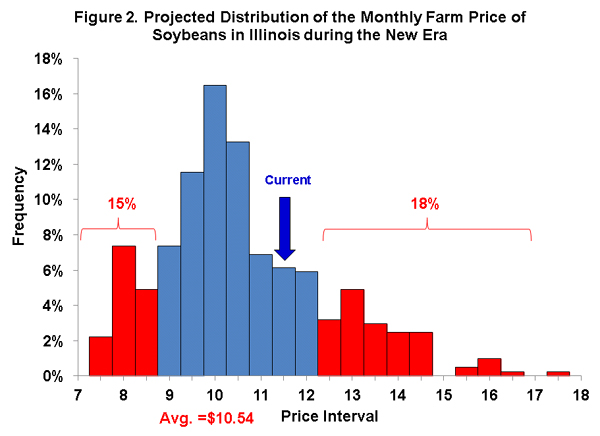
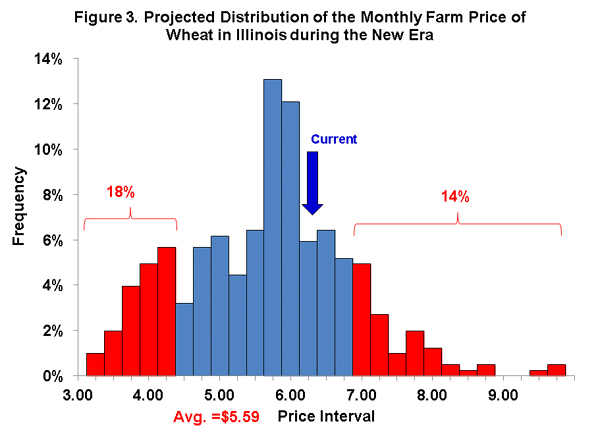
Figures 1, 2, and 3 show projected distributions of monthly prices of corn, soybeans, and wheat, respectively, in the new era. The distributions are developed by simply collecting the prices (as computed above) into the indicated intervals. In each case note that the distributions are centered on the average price to date for the new era: $4.32 for corn, $10.54 for soybeans, and $5.59 for wheat. The distributions allow us to project what might be considered “low” and “high” prices in the new era. The breaks in the distributions suggest the following rules of thumb for assessing prices:

Note that the categories were picked so that low and high prices occurred with about a 1 in 5 to 1 in 10 chance. Of course, it is important to keep in mind that these rules of thumb are no better than the projected distributions which they are based upon. We basically assumed that historical variation in prices will continue in the future, albeit at higher price levels.
Given the usual caveats, what does this imply for marketing old and new crop bushels today? With old crop prices about $6.50 and new crop around $5.25, the projected distributions indicate excellent pricing opportunities for corn. From a historical perspective, corn prices are clearly in the upper part of the distribution. Soybean and wheat prices are not high based on the distributions but they are nonetheless above the average projected for the new era.
As a final point, we think it is important not to forget how low prices can go even in this new era of substantially higher average prices. The projected distributions indicate there is a non-negligible chance of corn prices below $3.50, soybean prices below $9.00, and wheat prices below $4.50.
Disclaimer: We request all readers, electronic media and others follow our citation guidelines when re-posting articles from farmdoc daily. Guidelines are available here. The farmdoc daily website falls under University of Illinois copyright and intellectual property rights. For a detailed statement, please see the University of Illinois Copyright Information and Policies here.