


Impact of Estimated Farmer Bridge Assistance on 2025 Farmer Return Projections
Last week the USDA officially announced $12 billion in bridge assistance for US farmers to offset economic losses associated with low prices, high production costs, and trade disputes for the 2025 crop year. We provide estimates of what the bridge assistance payment rates could be for the larger acreage row crops, and incorporate the payment estimates for corn and soybeans into updated average farmer return estimates for regions of Illinois. Updated return estimates improve to slightly above breakeven levels for cash rent situations in northern and central Illinois, while return projections for southern Illinois in 2025 remain negative. We emphasize that the FBA payment levels used in these updates are estimates and that final payment levels, planned for release during the week of December 22nd, will likely differ. Further note that 2025 farmer return projections are increased by government payments – both from ARC/PLC and Farmer Bridge payments – which will be received in 2026.
Farmer Bridge Assistance Payment Estimates
On December 8th, 2025 the USDA announced a new round of ad hoc economic assistance for US farmers. The Farmer Bridge Assistance (FBA) program will provide $12 billion in support payments. The stated reason for FBA is to offset losses associated with unfair trade practices. $11 billion of the total will be used for payments to eligible row crop producers while the remaining $1 billion will go towards specialty crops. Specific payment rates are scheduled to be released the week of December 22nd, with payments being made to farmers by the end of February 2026.
While the payment rates for eligible row crops are still unknown, we estimate payment rates for the largest acreage row crops based on available information. The FBA payment rates will be based on acreage reporting data from the Farm Service Agency, cost of production estimates from the Economic Research Service (ERS), price and yield estimates from the USDA’s World Agricultural Supply and Demand Estimates (WASDE), and economic modeling. FBA payments are expected to provide support that is proportional to modeled economic losses for 2025 using uniform payment rates per payment acre. Based on that information, our estimates assume an approach very similar to that which was used to determine Emergency Commodity Assistant Program (ECAP) payments for losses in 2024 (see farmdoc daily articles from January 7, 2025 and March 25, 2025).
Estimates of per acre FBA payment rates for select commodities are summarized in Table 1. Yield and price estimates for all crops but peanuts are taken from the December WASDE report. The peanut yield estimate is taken from USDA’s December crop report, while the peanut price estimate is taken from FSA’s ARC/PLC program data. Per acre cost of production estimates are the latest estimates for 2025 from the ERS. We note that the cost of production estimates used here are from June 2025, and USDA is scheduled to release updated cost of production estimates on December 18, 2025 which may be used in determining final FBA payment rates. Acreage reporting data as of December 9, 2025 was used to estimate potential payment acres for each crop. Following the ECAP program approach, payment acres are assumed to be planted and failed acres plus 50% of prevent plant acres for each crop.
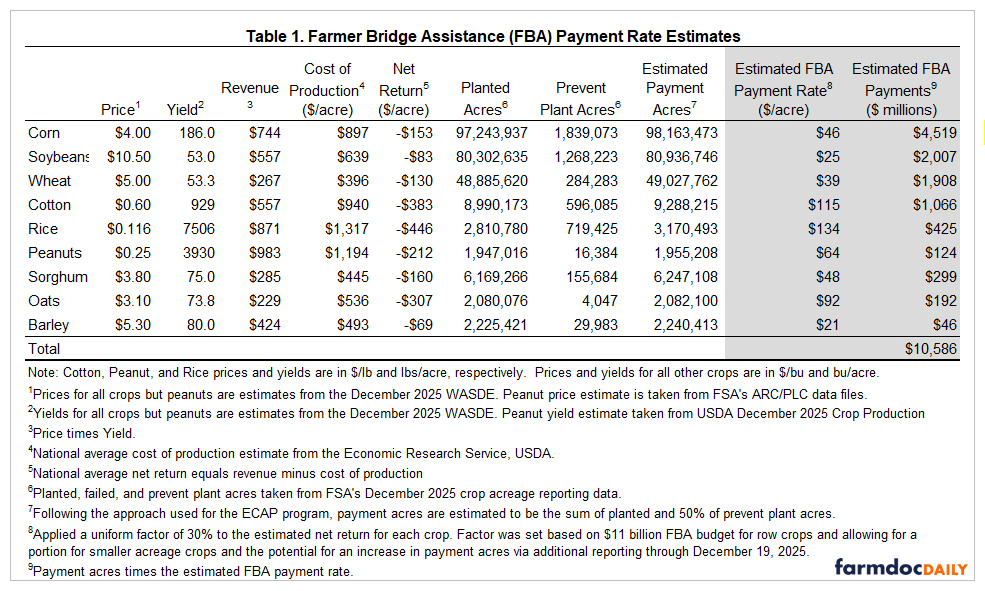
Using the data sources outlined above, an average net return estimate is computed for each crop for 2025, and the FBA payment rate is estimated as a flat percentage of estimated net losses that is uniform across all crops. The flat percentage used was 30% and was calibrated such that the resulting payment rate estimates, when applied to estimated payment acres, result in roughly $10.6 billion in total FBA payments going to the crops included in Table 1. This leaves just over $400 million for payments to the other smaller acreage eligible commodities.
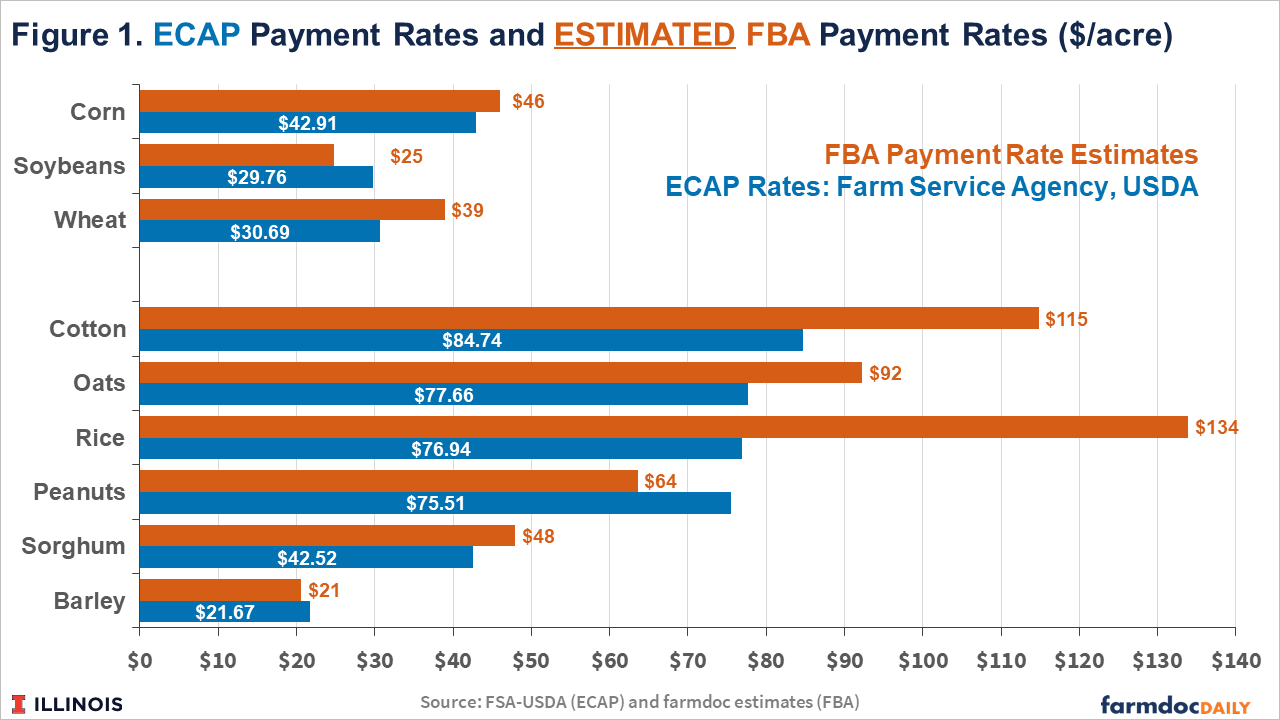
Estimated FBA payment rates range from $21 per acre for barley to $134 per acre for rice (see Table 1). The estimated payment rate for corn is $46 per acre. The estimated payment rate for soybeans is $25 per acre. The estimated payment rate for wheat is $39 per acre. Figure 1 compares the estimated FBA payment rates with those for the ECAP program. Estimated FBA payments exceed those from ECAP for most crops. Exceptions include peanuts, barley, and soybeans. Despite the budget for FBA payments being 10% higher than that for ECAP ($11 billion for row crops in FBA vs $10 billion in ECAP), the net returns implied by estimated prices, yields, and costs of production for 2025 differed from similar measures for eligible crops in 2024. This is perhaps most surprising for soybeans as it is the most often cited crop as being harmed by trade disputes.
Estimated Impact on Farmer Returns
Table 2 provides updated farmer return estimates for a 50-50 corn-soy rotation in each region of Illinois. The return estimates include the following updates to those released in August (see farmdoc daily from August 19, 2025):
- Corn price is increased from $3.95 to $4.00 for 2025. The soybean price is increased from $10 to $10.50.
- ARC/PLC payment estimates for each Illinois region are updated to reflect current price and yield expectations for 2025 (see farmdoc daily from November 18, 2025).
- Estimated FBA payments.
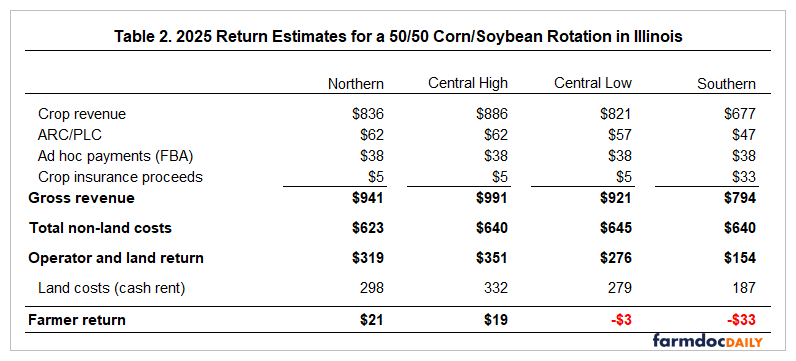
Estimates of total federal support payments for northern and central (high-productivity) Illinois are approximately $100 per acre for 2025. This includes a projected $62 per acre from ARC/PLC that would be made in October 2026, and roughly $38 per acre in estimated FBA payments expected to be received by February. Support payment estimates total $85 per acre for southern Illinois due to smaller estimated ARC/PLC payments of $47 per acre.
Estimated average farmer returns to cash rented farmland improve to $21 per acre in northern Illinois and $19 per acre for high productivity farmland in central Illinois. Estimated returns are just below break-even at -$3 per acre for low productivity farmland in central Illinois. Estimated returns in southern Illinois also improve relative to August projections but remain negative at -$33 per acre.
Discussion
The $12 billion in bridge assistance announced last week by the USDA is intended to provide more immediate support between now and when ARC/PLC payments for 2025 would be received in October of 2026. While payment rates have not yet been released, information provided about FBA was used to compute estimates which suggest around $35-40 per acre in support, on average, could be received by grain farms in Illinois. These FBA payments, in addition to the expected support from ARC/PLC, improves farmer return prospects compared with previous budget estimates released in August. Farms in northern and central Illinois are now projected to be at or slightly above break-even levels while average returns in southern Illinois remain negative even with the additional supported estimated from FBA.
Information provided by USDA on FBA payments and payment rate calculations does not suggest that projected support from Commodity Title programs or net indemnity payments from crop insurance programs for the 2025 crop year will be considered. Both commodity title payments (see farmdoc daily article from, November 18, 2025) and net crop insurance indemnities (see farmdoc daily article from, June 12, 2025) vary across commodities. Not including those payments in FBA calculations could result in some crops receiving total support that could exceed net losses based on estimated revenues (price times yield) and cost of production forecasts.
We caution readers that the FBA payment rates used in this article are only estimates. The procedures and specific data items used by USDA can, and likely will, differ from those used here. Final FBA payment rates should be released during the week of December 22nd. The final FBA rates will be incorporated into the next official Illinois crop budget update scheduled for January.
References
Paulson, N., G. Schnitkey, C. Zulauf and J. Coppess. "Impacts of Economic Assistance Payments." farmdoc daily (15):4, Department of Agricultural and Consumer Economics, University of Illinois at Urbana-Champaign, January 7, 2025.
Paulson, N., G. Schnitkey and C. Zulauf. "The 2025 Emergency Commodity Assistance Program." farmdoc daily (15):55, Department of Agricultural and Consumer Economics, University of Illinois at Urbana-Champaign, March 25, 2025.
Paulson, N., G. Schnitkey, B. Zwilling and C. Zulauf. "2026 Illinois Crop Budgets." farmdoc daily (15):150, Department of Agricultural and Consumer Economics, University of Illinois at Urbana-Champaign, August 19, 2025.
Paulson, N., H. Monaco, G. Schnitkey, J. Coppess and C. Zulauf. "Projected ARC and PLC Payments for 2025." farmdoc daily (15):213, Department of Agricultural and Consumer Economics, University of Illinois at Urbana-Champaign, November 18, 2025.
Zulauf, C., G. Schnitkey, J. Coppess and N. Paulson. "Crop Insurance, Premium Subsidies, and Soybean-Corn Disparity." farmdoc daily (15):108, Department of Agricultural and Consumer Economics, University of Illinois at Urbana-Champaign, June 12, 2025.
Disclaimer: We request all readers, electronic media and others follow our citation guidelines when re-posting articles from farmdoc daily. Guidelines are available here. The farmdoc daily website falls under University of Illinois copyright and intellectual property rights. For a detailed statement, please see the University of Illinois Copyright Information and Policies here.