


Impacts of Differences between RMA Projected Prices and Futures Prices on the Level and Frequency of Crop Insurance Indemnity Payments
The Projected Prices (PPs) for corn and soybeans for 2026 were recently released by the Risk Management Agency (RMA). Settlement prices for the December corn and November soybean futures contracts averaged $4.62 and $11.09 during the February price discovery period (see farmdoc daily from March 3, 2026). Futures prices for both crops trended upward during February and have continued to increase during the first two weeks of March resulting in current market expectations for corn and soybean prices at harvest being above the levels used to determine the value of insurance guarantees for farmers.
The purpose of this article is to demonstrate the impact on expected payments from crop insurance products and the frequency of those payments that result based on differences between actual futures prices during the insurance sales period, and the Projected Prices used to establish guaranteed revenue levels in farmers’ crop insurance products.
Projected Prices
The RMA establishes Projected Prices used to establish crop insurance guarantees by averaging the December Corn and November Soybean futures prices for all trade days during February. Crop insurance policies can then be purchased until the Sales Closing Date (March 15 through much of the corn belt). For revenue policies, the guaranteed revenue levels are meant to reflect the expected revenue a producer would receive based on market conditions for that year. This framework embeds the assumption that futures prices represent an unbiased estimate of the prices that would occur at harvest. Thus, the difference in the Harvest Price from the Projected Price represents changes in the producer’s revenue at harvest from expected revenue.
However, movements and trends in futures during February and through the first two weeks of March can result in actual futures prices at the time of crop insurance purchase differing substantially from the PP set across the month of February. Importantly, RMA does not adjust the rated price of insurance products based on differences in actual futures prices compared to the PP. Differences between the PP and actual futures can result in the premium cost of insurance being under- or over-valued. If for example, corn futures prices trended downward smoothly from $5 per bushel to $4 per bushel through February, the PP would be somewhere around $4.50 and would overstate the revenue a producer could otherwise hedge at actual market prices of $4 per bushel and increase the likelihood of an indemnity. In contrast, if prices trended from $4 to $5 , the PP would still be $4.50, but would then understate the expected revenue to the producer – and thus be less likely to result in an indemnity payment.
Price Movements in 2025 and 2026
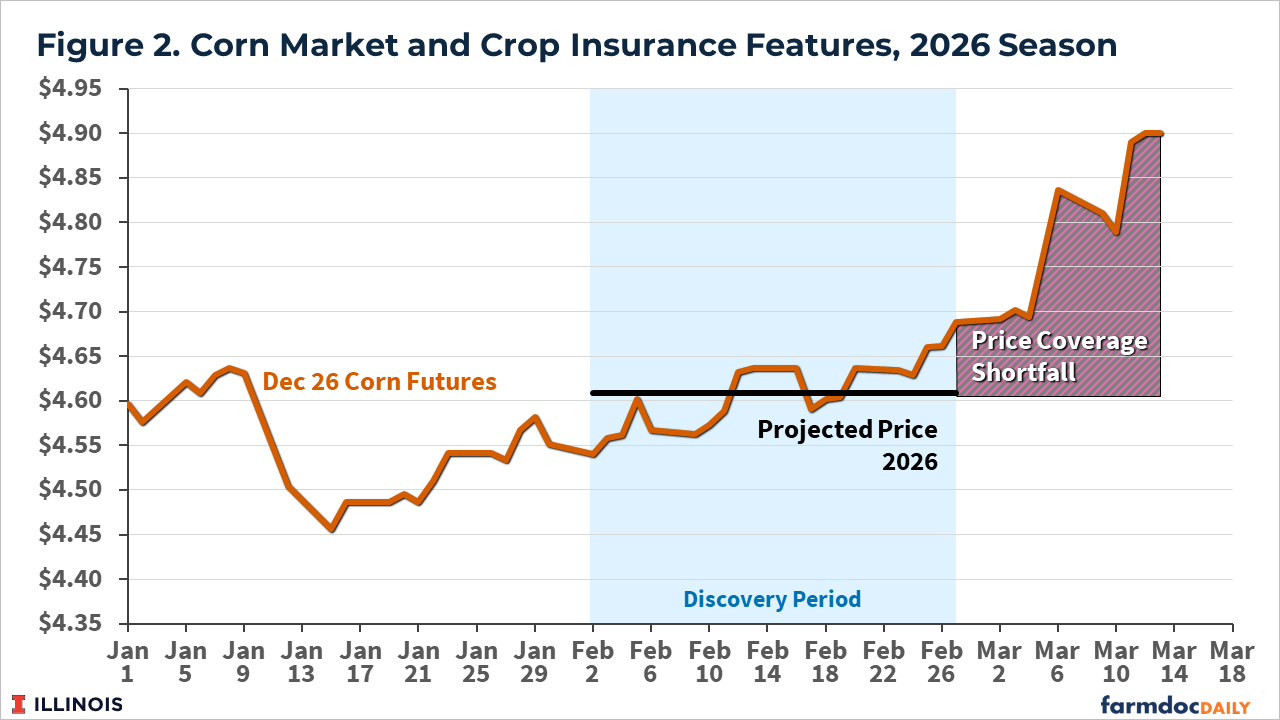
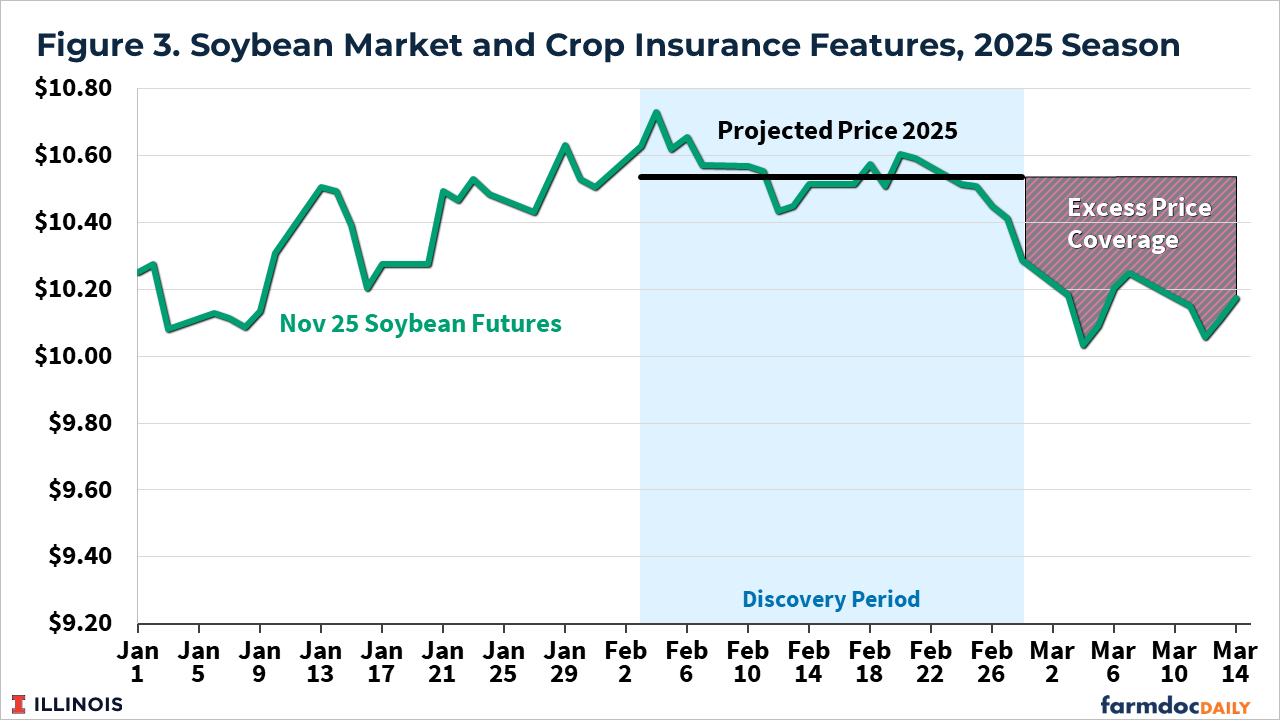
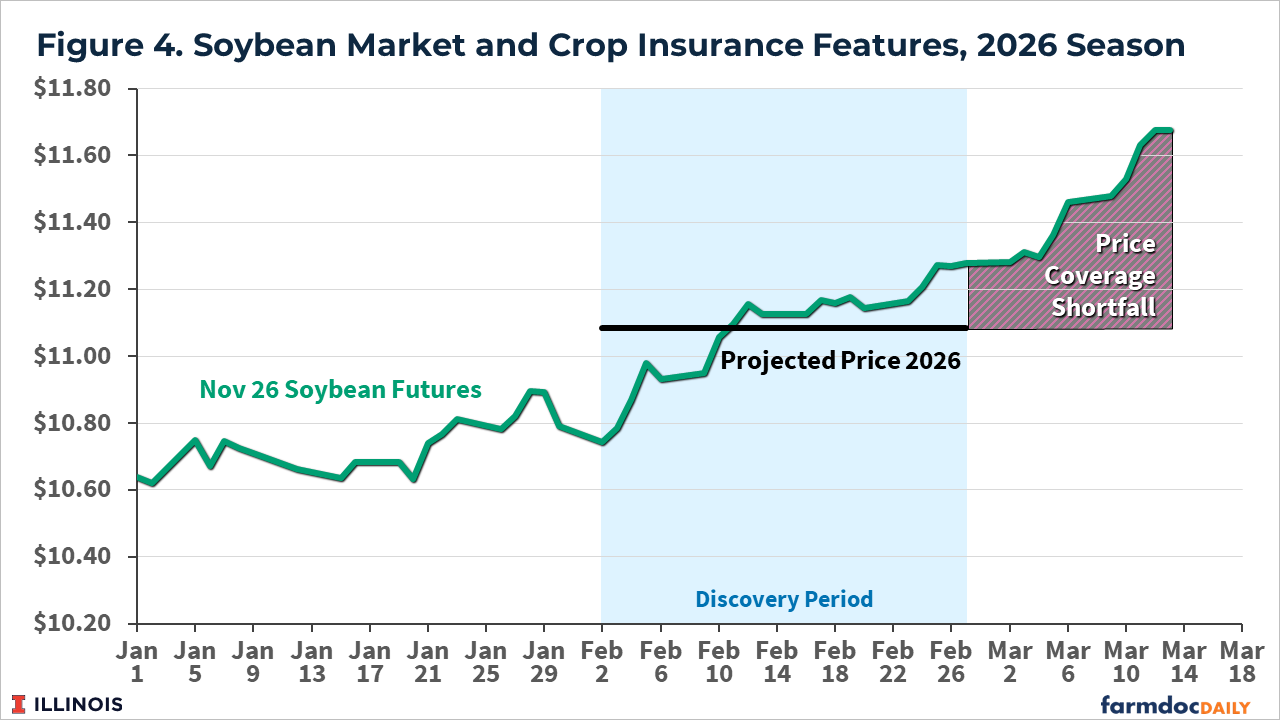
The two hypothetical cases discussed in the previous paragraphs are similar to the cases that happened in 2025 and 2026. Figures 1 and 2 show the relationship between corn futures prices during the month of February 2025 and the Projected Prices, along with the pattern of prices through the Sales Closing Date for 2025 and 2026. Figures 3 and 4 provide analogous information for soybeans. The width of the price range displayed in the graphs is the same between years in each case to provide a sense of relative scale with prices in 2026 for soybeans on a scale that is shifted upward by $1.
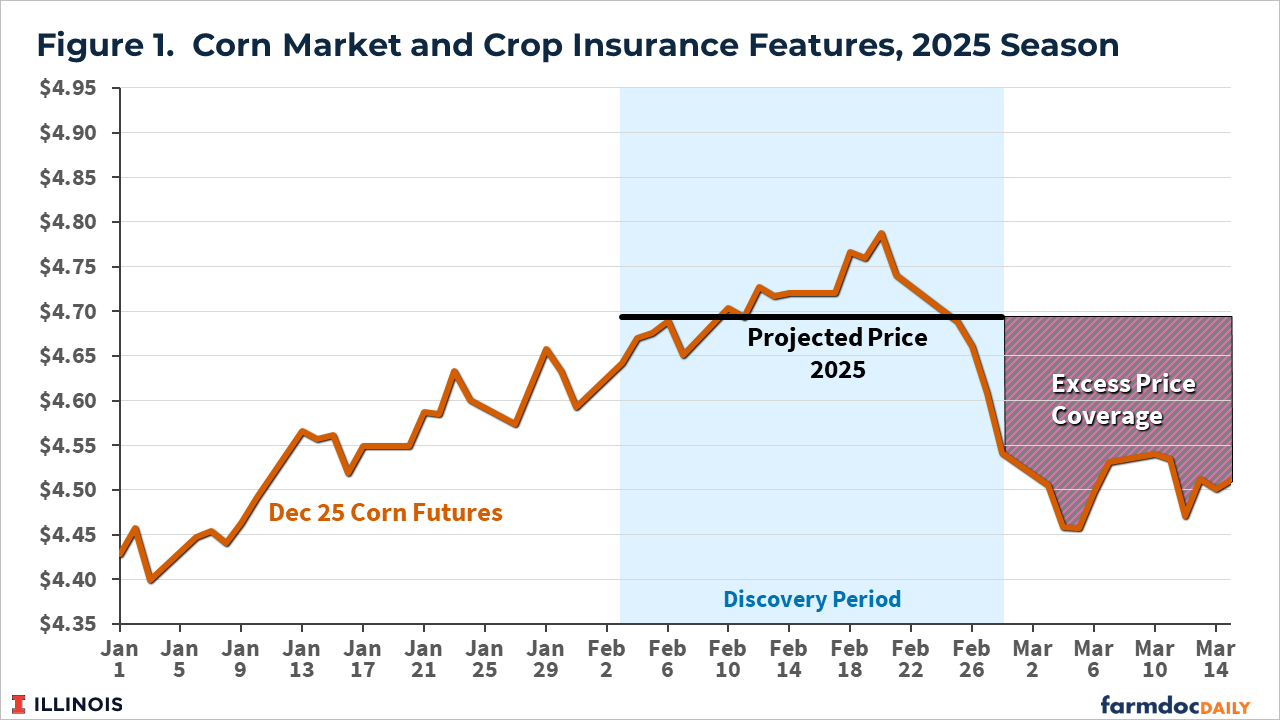
In Figure 1, the drop in corn futures prices that occurred between 2/20/25 and 3/5/25 resulted in PPs that were well above actual futures prices. The difference between the PP and futures price could be viewed as excess price coverage and is equivalent to having a put option that is “in the money” by the difference between futures prices and the insurance price.
Figure 2 shows the case for corn in 2026 during which the opposite pattern occurred with increasing futures prices throughout February and beyond. The resulting projected price understates the market’s best estimate of available revenue. Prices would have to cross back below the insured price to trigger an indemnity, all else equal. Relative to the case where the initial futures price and projected prices were equal, the insurance is now less valuable because of the price coverage shortfall at the date of purchase. Figures 3 and 4 provide similar information for soybeans with directionally identical implications.
Crop Insurance Impacts
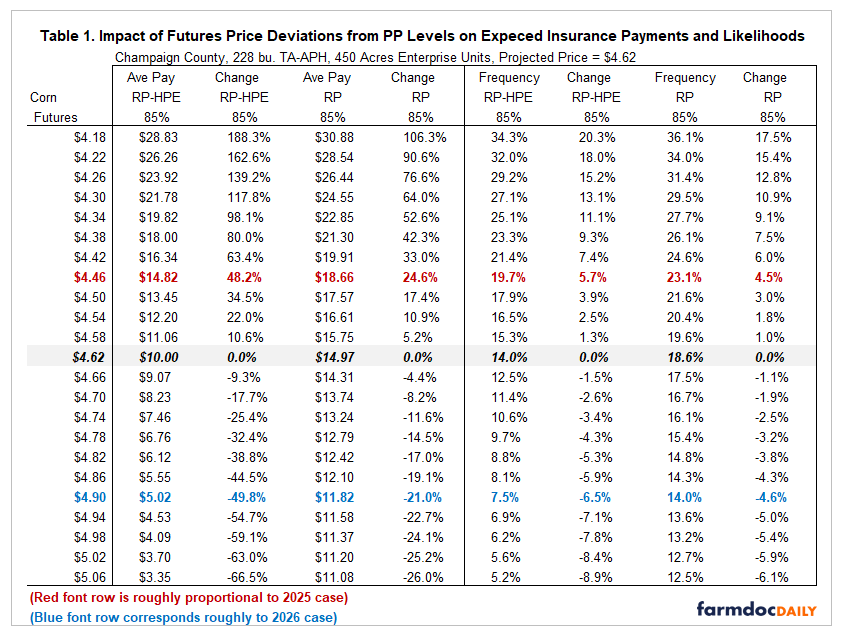
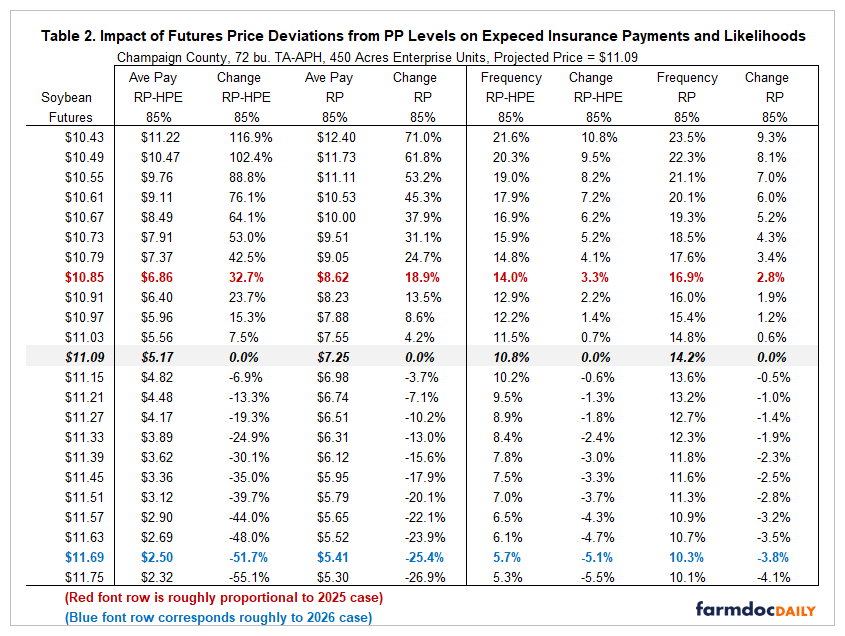
To provide a sense of the magnitude of the implications for insurance performance, an example is developed for a case farm in Champaign County Illinois for both corn and soybeans across a set of possible differences between projected prices and futures prices during the insurance sales window. Procedures used in the Crop Insurance Evaluator available at farmdoc (https://fd-tools.ncsa.illinois.edu/evaluator; see farmdoc daily from February 10, 2026) were replicated and extended to determine the impacts of differences between projected prices and possible futures prices, all scaled to 2026 conditions, and centered on the case where Projected Prices and futures prices were identical at $4.62 for corn and $11.09 for soybeans, depicted in the shaded portions of tables 1 and 2. The analysis focuses on the farm-level products of Revenue Protection (RP) and Revenue Protection-Harvest Price Exclusion (RP-HPE) but the directional effects when bundled with Supplemental Coverage Option (SCO) or Enhanced Coverage Option (ECO) are similar. In fact, in many cases when SCO and ECO are included, the effects are more pronounced because of the lower variability of county yield distributions compared to farm yield distributions, and the greater degree to which shifting price distributions impact the probability of payments.
with on area products are similar and in many cases more pronounced because of the lower variability of county yield distributions compared to individual yield distributions and the greater degree to which shifting price distributions impact the probability of payments.
Table 1 shows the base case organized in two sections. The left section focused on payment levels and impacts on payment likelihoods and the right section focused on frequency of payments. The shaded row near the center of the table is the base case with futures equal to the Projected Price. Rows above represent cases like 2025 with futures prices below the PP during the sales period and rows below represent cases like 2026 with futures prices above the PP. In the base-case row with futures prices equal to the PP, the resulting average insurance payments for RP-HPE 85% insurance is $10/acre and for RP-85% it is $14.97/acre. The frequency of payment at 14% for RP-HPE 85% and at 18.6% or almost 1 in 5 years for RP 85% insurance.
The red font row of Table 1 considers a case similar to that of 2025 with corn futures prices declining nearly $.16 from the PP, which in terms of 2026 prices would result in a futures price of $4.46. In that case, RP 85% insurance would be expected to make payments of $18.86/acre or a 24% increase relative to the base case. Continuing across that same row, the likelihood for an RP 85% insurance payment would increase from 18.6% to 23.1%, or a little less than 1 in four years representing an increase of 4.5%. Note that market-based revenue would be expected to decline as well but due to the negative correlation between prices and yields, it is not straightforward to calculate and not as great as the price change times the APH).
In 2026, shown in the blue font row, futures prices increased to around $4.90 as this article is being written. As a result, RP-HPE 85% insurance’s expected payment declines by 50% to only $5.02/acre while RP 85% insurance expected payment declines to $11.82/acre or by 21%. RP declines less in value than RP-HPE because of the potential for a higher guaranteed value if the Harvest Price exceeds the PP. The likelihood for RP 85% insurance to make a non-zero payment declines from 18.6% to 14%
Table 2 contains analogous information for soybeans. In 2026, soybeans have had a substantial increase in prices relative to the PP established in February, making insurance’s expected payment lower and less frequent. Note that the impact on farm revenue of increases in prices is greater than the decline in insurance payments in all cases, and thus a reduction in insurance values but a larger increase in expected revenues remains a net positive outcome for the farm in terms of expected total revenues.
It is important to appreciate the nuances that arise from the process used to establish Projected Prices, and the differences that can accrue when market prices differ over crop insurance sales period. Marketing activities including hedging at higher prices, and use of options to increase effective floor prices can be used to mitigate some of the impacts of market price changes not reflected in insured revenues as well. In years like 2025, crop insurance can carry a “boost” of value relative to expected market revenue, and in years like 2026 with increases in market prices, the role of crop insurance in impacting total expected revenue is reduced relative to a case in which Projected Prices and futures prices were the same.
References
Monaco, H., G. Schnitkey, N. Paulson, J. Coppess, B. Sherrick, C. Zulauf, C. Navarro, P. Shan and L. Fu. "Release of Insurance Evaluator with the New SCO and ECO." farmdoc daily (16):21, Department of Agricultural and Consumer Economics, University of Illinois at Urbana-Champaign, February 10, 2026.
Paulson, N., G. Schnitkey, H. Monaco, B. Sherrick and C. Zulauf. "Projected Prices and Volatility Factors for 2026." farmdoc daily (16):34, Department of Agricultural and Consumer Economics, University of Illinois at Urbana-Champaign, March 3, 2026.
Disclaimer: We request all readers, electronic media and others follow our citation guidelines when re-posting articles from farmdoc daily. Guidelines are available here. The farmdoc daily website falls under University of Illinois copyright and intellectual property rights. For a detailed statement, please see the University of Illinois Copyright Information and Policies here.