


USDA Baseline Points to Declining U.S. Row Crop Acreage
The U.S. Department of Agriculture’s most recent ten-year projection through 2035 points to a gradual but persistent decline in U.S. planted acreage to major row crops. In recent decades, total U.S. crop acreage has tended to remain relatively stable, with adjustments occurring primarily through shifts among crops. In contrast, the current baseline projects an outright reduction in total row crop acres under price levels near their long-run averages.
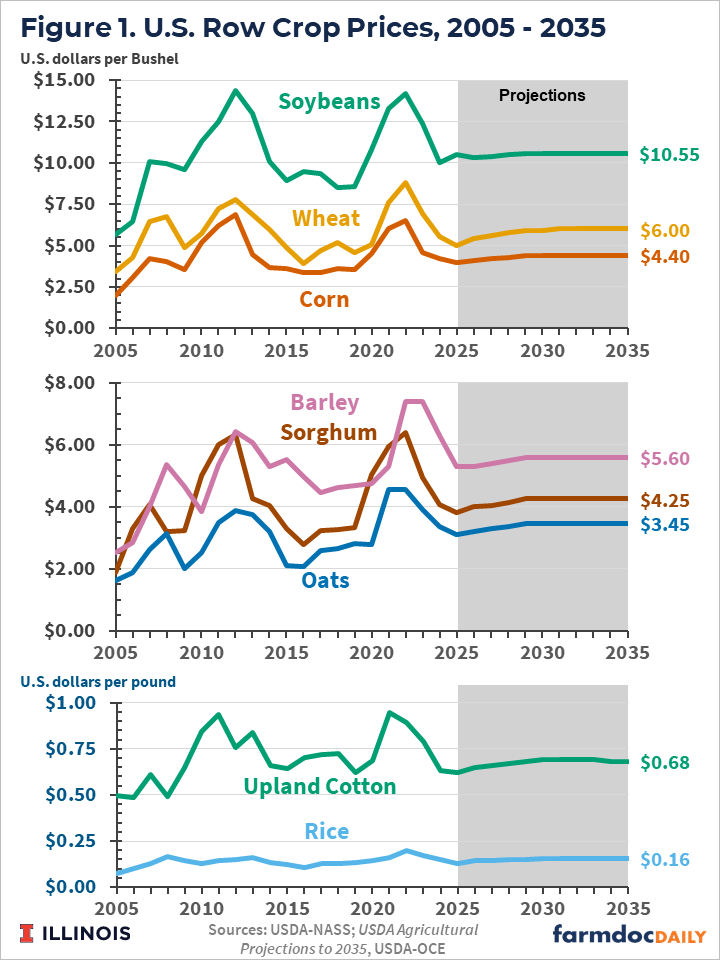
Long-run prices are projected at $4.40 per bushel for corn and $10.55 per bushel for soybeans. These projections reflect policy assumptions in place at the time the baseline was constructed, including limited adoption of E15 (15% ethanol blend) and Renewable Fuel Standard (RFS) levels consistent with the Environmental Protection Agency (EPA)’s June 2025 proposal, both of which influence biofuel-related demand for corn and soybeans. USDA’s long-term projections point to a broader challenge for U.S. agriculture: Without significant demand increases, prices will remain relatively low, and acres may exit agriculture. While temporary supply disruptions could raise prices and support acreage in the short-run, they are unlikely to alter the longer-run trend, and continued improvements in productivity tend to reinforce the projected decline in acreage.
USDA Projections
Each year, the U.S. Department of Agriculture releases long-term projections that provide a benchmark for U.S. agricultural markets. These projections reflect how markets are expected to evolve if the policy, technology, and demand trends in place when the projections are made were to continue without major disruptions. The most recent baseline, released in February 2026, extends through 2035.
Commodity price expectations play a role in the USDA’s acreage projections. Prices for most row crops were elevated in the early 2020s due to supply disruptions and strong demand. Corn, for instance, had its farm price reach $6.54 per bushel in the 2022/23 market year. Prices have since declined, however, and over the coming decade, prices are expected to be at levels much more consistent with average prices over the past 20 years. Figure 1 provides historical prices back to 2005 and USDA’s baseline projections through 2035 for the 8 major row crops. The longer-term projected averages are $4.40 for corn, $10.55 for soybeans, and $6.00 for wheat (see upper panel of Figure 1).
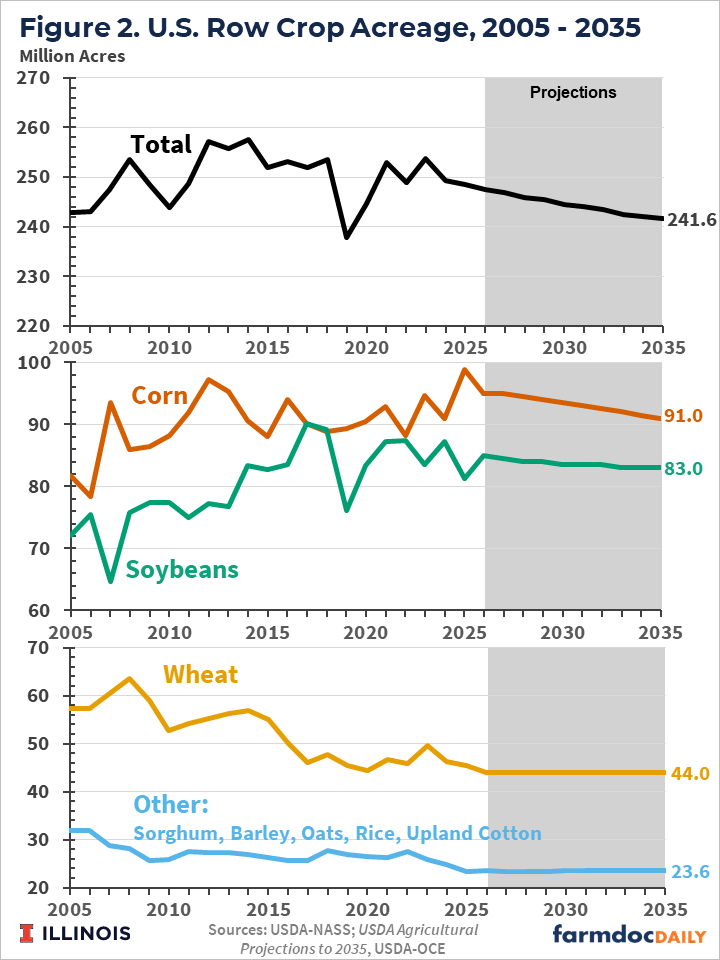
Under the anticipated price conditions, total planted acreage for the eight major row crops is projected to decline to 241.6 million acres in 2035/36. This is a 6 million acre reduction from the projected 247.6 million acres in 2026/27, and 8 million acres fewer than the longer-term average of 250 million row crop acres since 2005.
Figure 2 shows historical row crop acreage since 2005 with USDA’s baseline projections from 2026 to 2035. From 2026 to 2035, projected corn acreage declines by four million acres and soybeans by two million acres (see middle panel of Figure 2). For the remaining row crops (wheat, upland cotton, sorghum, barley, oats, and rice), planted acreage is projected to remain stable over the projection period (see lower panel of figure 2). A modest increase in Conservation Reserve Program (CRP) enrollment of 0.4 million acres accounts for a small share of the decline in planted row crop acreage. The baseline otherwise provides limited detail on where acres transition, instead reflecting the adjustment of row crop acreage to lower projected returns under the assumed price environment.
Over the past 30 years, U.S. row crop acreage has tended to remain relatively stable, with adjustments occurring primarily through shifts among crops. For example, corn and soybean acreage has generally increased over time while acreage planted to other feed grains has declined. In contrast, the current baseline projects an outright decline in total planted acreage, indicating a shift from acreage reallocation within agriculture to a reduction in overall row crop area.
Despite acreage changes, total production for all major U.S. crops is projected to increase except sorghum, where production remains flat. For corn and soybeans, yield growth more than offsets declining acreage, resulting in continued expansion in output. For the remaining crops, yield gains combine with stable or slightly increasing acreage to support production growth without requiring reductions in planted area.
While prices for most crops are projected to stabilize over the projection period, the underlying balance between supply and demand differs across commodities. For crops such as corn and soybeans, yield-driven supply growth exceeds demand growth by a wider margin, placing downward pressure on returns and contributing to reductions in planted acreage. For other crops, supply and demand remain more closely aligned, allowing acreage to remain relatively stable.
The projected decline in corn acreage reflects a mismatch between continued growth in supply and limited gains in demand. Corn output expands over the projection period due to sustained improvements in yields, but total demand grows only modestly. Ethanol use is projected to remain essentially flat at around 5.6 billion bushels, as increases in ethanol exports offset weaker domestic consumption. Food, seed, and non-ethanol industrial uses are projected to decline slightly due to a downward trend in high-fructose corn syrup production, while feed use remains relatively stable. Although exports are expected to increase by about 15 percent over the period, total demand grows by only 3.9 percent. By contrast, a simple comparison illustrates the imbalance: holding acreage, imports, and stocks fixed at their initial projection levels, yield gains alone would result in a supply increase of approximately 8.7 percent over the same period, well above projected demand growth of 3.9 percent. This gap highlights how yield-driven supply growth outpaces demand, consistent with the projected decline in corn acreage.
The projected modest decline in soybean acreage reflects demand growth that is positive, but not sufficient to keep pace with continued gains in supply driven by yield improvements. Domestic use expands primarily through increased processing, as crush rises alongside expanding capacity in response to growing demand for soybean oil in biofuel production. Because soybeans are jointly processed into oil and meal, sustained increases in crush also require continued growth in soybean meal demand, which is supported by gradual expansion in livestock production and contributes to modest increases in meal prices over the projection period.
Beyond domestic use, U.S. soybean exports are projected to increase only moderately, as global demand growth slows relative to the previous decade and competition from Brazil limits gains in U.S. market share. In total, soybean demand is projected to grow by about 6.2 percent over the projection period. By contrast, holding acreage, imports, and stocks fixed at their initial projection levels, yield gains would result in a supply increase of approximately 7.9 percent. This smaller but still meaningful gap helps explain the more modest decline in soybean acreage relative to corn.
Biofuels and the Evolving Demand Landscape
Biofuels remain a central component of demand for both corn and soybeans, and the USDA baseline reflects the policy environment as of late 2025. However, two key assumptions embedded in the projections are particularly important for understanding the outlook for crop acreage and warrant further examination.
First, the baseline effectively assumes that adoption of higher ethanol blends such as E15 remains limited. Since U.S. gasoline consumption declines through most of the projection period, domestic ethanol use likewise declines over the coming decade. Increases in ethanol exports offset this trend in domestic use, leaving total corn use for ethanol essentially flat. Given the importance of ethanol in total corn use, alternative assumptions regarding expanded E15 adoption could materially alter the demand outlook and, in turn, projections for corn acreage.
Second, the baseline incorporates RFS policy assumptions that are broadly consistent with the EPA’s June 2025 proposal. However, the finalized rule released on March 27, 2026 includes higher Renewable Volume Obligations (RVOs) and a different allocation of Small Refinery Exemptions (SREs) than what was proposed in June. These changes may have important implications for biofuel production and feedstock demand, particularly for vegetable oils used in biomass-based diesel. Because soybean oil is a primary feedstock in these markets, the revisions to RFS policy could influence soybean oil use, soybean crush, and ultimately soybean acreage.
Taken together, these two assumptions play a central role in shaping the baseline projections for both corn and soybeans. Ethanol use is projected to remain essentially flat, providing no additional source of demand growth for corn. At the same time, biomass-based diesel demand is determined by Renewable Fuel Standard policy assumptions that differ from the finalized rule. Under baseline assumptions, biofuels do not generate sufficient demand growth to offset yield-driven increases in supply.
Conclusions
USDA’s long-term projections indicate that, under the baseline policy and market assumptions, yield-driven growth in supply exceeds demand growth for major U.S. crops. As a result, prices are projected to stabilize at levels that place downward pressure on returns, contributing to gradual reductions in planted acreage, particularly for corn and soybeans.
These projections highlight a shift in how acreage adjusts over time: rather than reallocating among crops, total planted area is projected to decline. This shift reflects projected supply and demand conditions in which increases in productivity are sufficient to meet expected use, limiting incentives for acreage expansion. This article is the first in a series examining how alternative assumptions, including ethanol blending and RFS policy, may affect long-run supply, demand, and acreage outcomes.
References
United States Department of Agriculture, Office of the Chief Economist. USDA Agricultural Projections to 2035. Economic Research Service, United States Department of Agriculture, February 2026. Available at: https://www.ers.usda.gov/publications/pub-details?pubid=113816
U.S. Environmental Protection Agency. “Proposed Renewable Fuel Standards for 2026 and 2027.” https://www.epa.gov/renewable-fuel-standard/proposed-renewable-fuel-standards-2026-and-2027
U.S. Environmental Protection Agency. “Final Renewable Fuel Standards for 2026 and 2027.” https://www.epa.gov/renewable-fuel-standard/final-renewable-fuel-standards-2026-and-2027
USDA National Agricultural Statistics Service. Quick Stats Database. Washington, DC: United States Department of Agriculture. Available at: https://quickstats.nass.usda.gov/
Disclaimer: We request all readers, electronic media and others follow our citation guidelines when re-posting articles from farmdoc daily. Guidelines are available here. The farmdoc daily website falls under University of Illinois copyright and intellectual property rights. For a detailed statement, please see the University of Illinois Copyright Information and Policies here.