


2025 NASS County Corn, Soybean, and Winter Wheat Yields
The National Agricultural Statistics Service (NASS) of the USDA recently released 2025 county yield estimates for corn, soybeans, and winter wheat. County yields tended to exceed the national average in the main Corn Belt region of the Midwest, while yields tended to be below the average in other areas. The number of individual U.S. counties with yield estimates reported has continued to decline.
U.S. County Corn Yields
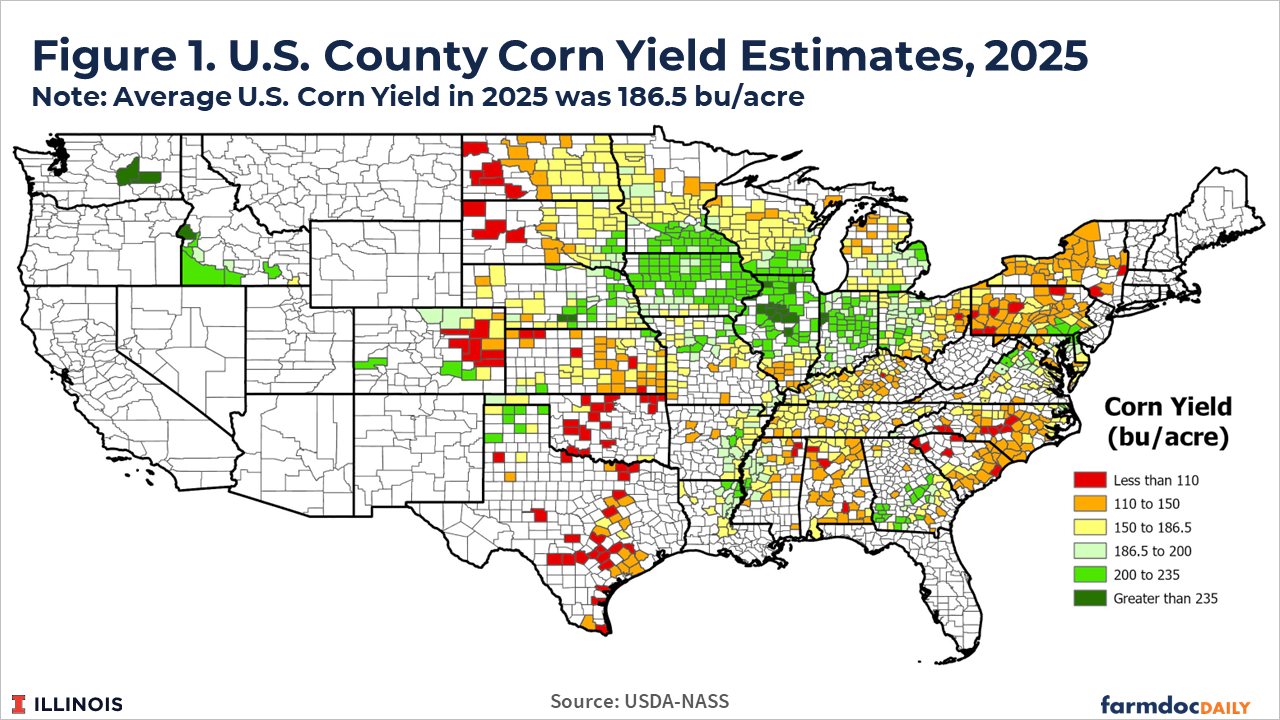
Figure 1 shows county corn yield estimates for 2025 as reported by USDA-NASS. These corn yields – and soybean and winter wheat yields — are for “all” production, regardless of whether it comes from irrigated or non-irrigated farmland. The average corn yield in the U.S. was a record-setting 186.5 bushels per acre in 2025. Counties with yield estimates below the national average are shown in yellow, orange and red in figure 1, while counties with yield estimates above the national average are shown in shades of green.
Corn yields were above the national average in eastern Nebraska, Iowa, Illinois, Indiana, and western Ohio. The highest yields were in Illinois, with a cluster of particularly high yield counties in central Illinois. Yields were also above average in most counties in the southern parts of Minnesota and Wisconsin. Corn yields below the national average occurred in most counties with reported yield estimates in the Dakotas, western Nebraska, eastern Colorado, Kansas, Oklahoma, and Texas. Most counties in the southeastern and northeastern US also had corn yields below the national average in 2025. Exceptions include some counties in Georgia and areas of the Mississippi Delta in Arkansas, Louisiana, and Mississippi.
U.S. County Soybean Yields
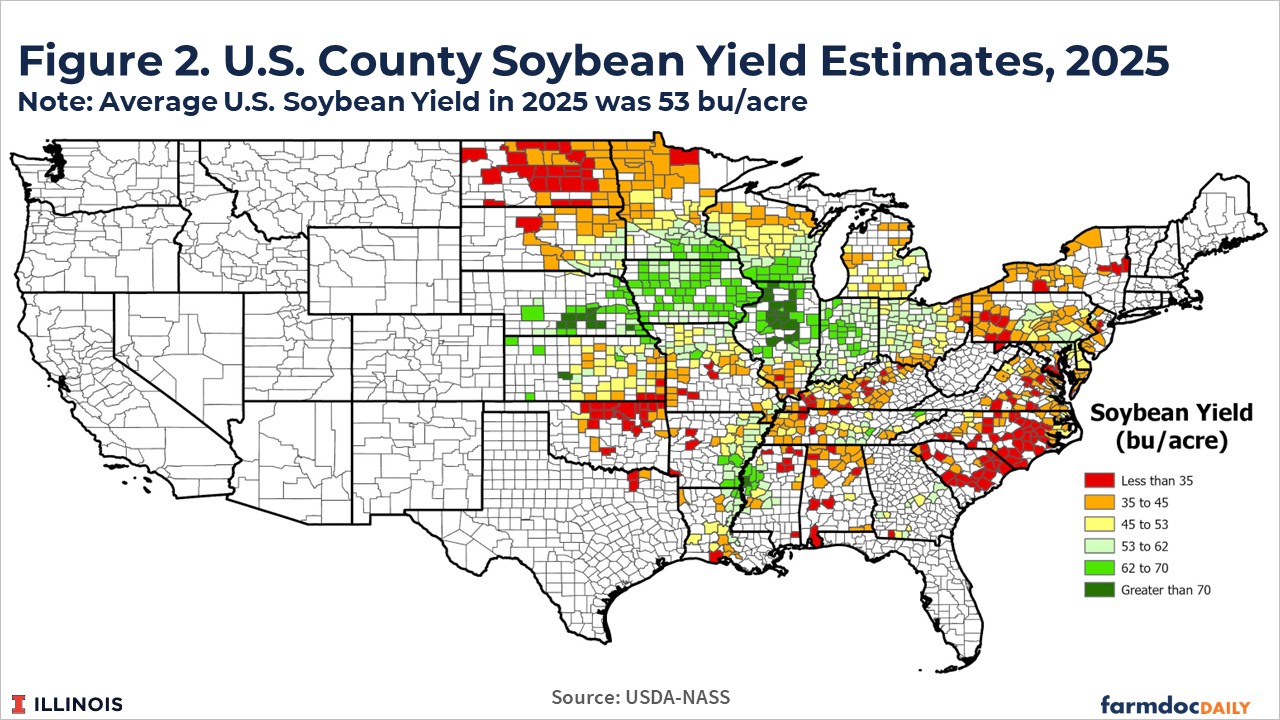
Figure 2 shows county soybean yield estimates for 2025. The average soybean yield in the U.S. was 53 bushels per acre in 2025, also a record high. Similar to corn, soybean yields exceeded the U.S. national average across the Midwest from eastern Nebraska into western Ohio, the southern regions of Minnesota and Wisconsin, and parts of Arkansas, Louisiana, and Mississippi. Soybean yields were over 70 bushels in central Illinois and in central Nebraska. Soybean yields were below the US average yield in most other regions where county estimates were reported.
U.S. County Winter Wheat Yields
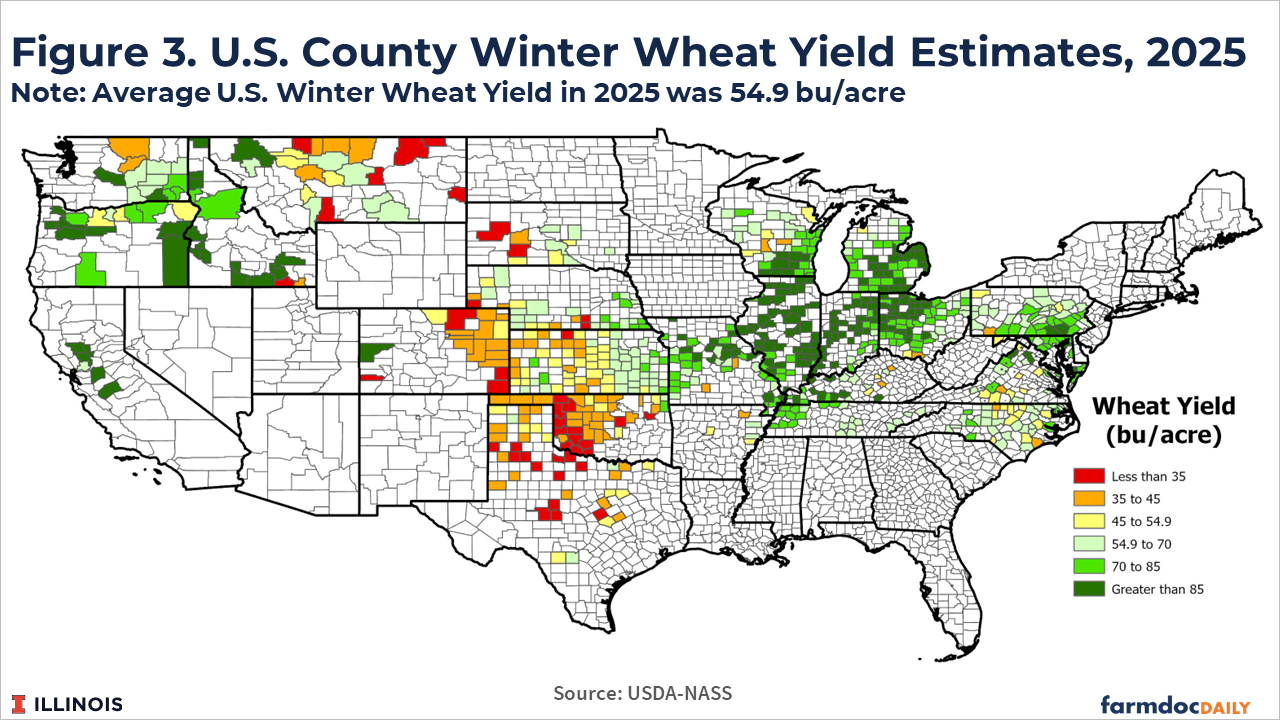
Figure 3 shows county winter wheat yield estimates for 2025. The average winter wheat yield in the U.S. was 54.9 bushels per acre, the second highest behind the 55.3 bushels per acre in 2016. Wheat yields were above the national average in most counties in the Midwest and in the Pacific Northwest. Winter wheat yields were above the national average in eastern Kansas but below the national average in western Kansas and in the other states with large winter wheat acreage (Montana, Colorado, Oklahoma, and Texas).
Illinois County Yields
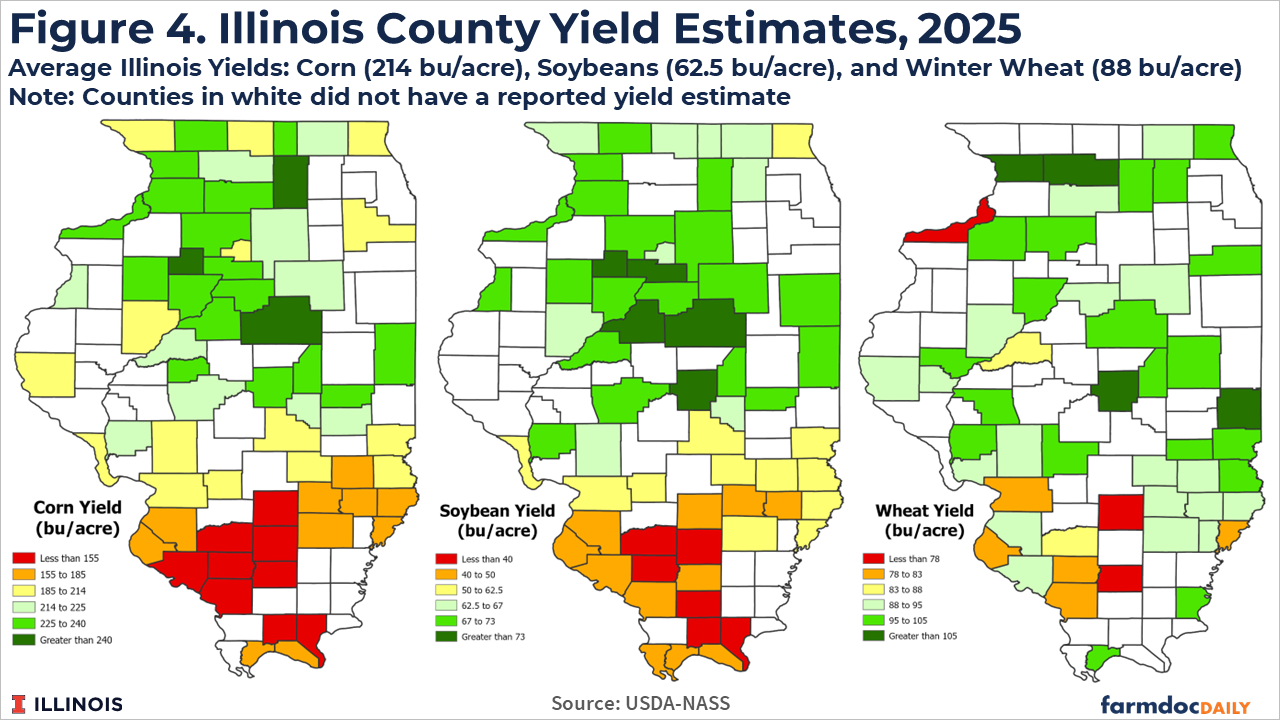
Figure 4 shows county yield estimates for Illinois in 2025. Corn yields averaged 214 bushels per acre, soybeans yields averaged 62.5, and the average wheat yield was 88 bushels per acre. As is typical, yields above the statewide average were common in the northern two-thirds of the state, with yields below the statewide average in southern Illinois. For corn, yields exceeded 240 bushels per acre in Stark, McLean, and DeKalb counties in central and northern Illinois. For soybeans, yields exceeded 73 bushels per acre in Stark, Marshall, Tazewell, McLean, and Macon counties. Corn and soybean yield estimates were well below the state average in most southern Illinois counties.
Wheat yields followed a similar pattern. Average winter wheat yields exceeded 105 bushels per acre in Carroll and Ogle counties in northern Illinois and in Macon and Edgar counties in central Illinois. Wheat yields were near or below the state average in most southern Illinois counties where the majority of Illinois wheat acres are located. Wheat yields were below 78 bushels per acre in Franklin and Marion counties.
Counties for Which Yield Estimates are Reported
The NASS county yield estimates are an important source of information for multiple uses. While not the sole or primary source, NASS yields can impact calculations for government payment programs such as ARC/PLC and federal crop insurance. Yields reported by NASS are also commonly used as benchmarks to inform management and planning decisions at the farm-level as well as further along the supply chain.
USDA-NASS reports yield estimates for those counties where sufficient survey responses are collected. The number of individual counties where enough farmer responses were received for yield estimates to be reported in 2025 was down for both corn and soybeans compared with 2024. County-level winter wheat yield estimates were not provided in 2024 except for Illinois, but the number of counties with a reported winter wheat yield estimate in 2025 was down from 2023. Overall, there has been a persistent decline in counties with reported county yields for corn soybeans and wheat over the past two decades (see Figure 5).
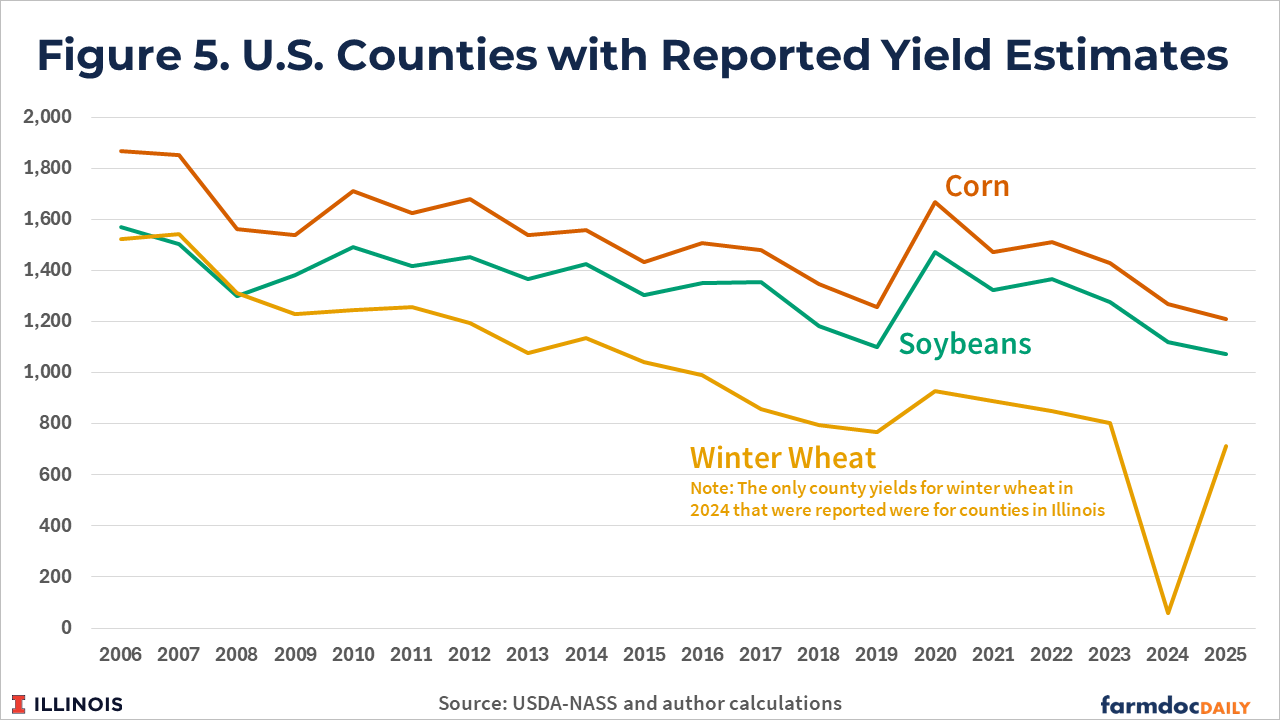
While the decline in acreage planted to wheat over time also contributes to fewer counties with reported yields (see farmdoc daily article from April 14, 2026), the decline in counties with yield estimates can also be linked to lower response rates to USDA surveys. Declining response rates is an issue impacting USDA data more broadly than just county yield estimates (more on this issue is available here, here, and here). Lower response rates lead to less data being available and potential issues with the accuracy and reliability of data that is made available.
Discussion
U.S. corn and soybean yields reached record levels in 2025 while the U.S. winter wheat yield was second only to the yield in 2016. Following the typical pattern, corn and soybean yields where highest in the main Corn Belt region of the Midwest U.S. with lower yields estimated in counties in surrounding areas. Wheat yields are also high in the Midwest but yields in the primary production regions ranged from above average in the Pacific Northwest and eastern Kansas to below average in most of Oklahoma, Texas, and Colorado.
While the NASS estimates are not the primary or only source of information for the final county yields that will be used by the Farm Service Agency to calculate ARC payments, their release does provide additional information upon which to base payment estimates (see farmdoc daily articles from November 2, 2017, February 25, 2020, and May 13, 2025 for further discussion and comparison of different USDA agency yield estimates). An upcoming farmdoc daily article will incorporate the NASS yield estimates, as well as the most recent marketing year average prices projections from the USDA, to provide updated projections for 2025 ARC and PLC payments for corn, soybean, and wheat base acres.
References
Paulson, N., G. Schnitkey and C. Zulauf. "2024 NASS County Corn and Soybean Yields." farmdoc daily (15):88, Department of Agricultural and Consumer Economics, University of Illinois at Urbana-Champaign, May 13, 2025.
Paulson, N., G. Schnitkey, J. Coppess, C. Zulauf and R. Goodrich. "Historical View of U.S. Row Crop Acreage." farmdoc daily (16):64, Department of Agricultural and Consumer Economics, University of Illinois at Urbana-Champaign, April 14, 2026.
Schnitkey, G., C. Zulauf, N. Paulson, K. Swanson and J. Coppess. "Understanding FSA Yields Used to Calculate 2019 ARC-CO Payments." farmdoc daily (10):186, Department of Agricultural and Consumer Economics, University of Illinois at Urbana-Champaign, October 20, 2020.
Zulauf, C., G. Schnitkey, N. Paulson and J. Coppess. "Comparing NASS and RMA County Yields for Corn." farmdoc daily (7):202, Department of Agricultural and Consumer Economics, University of Illinois at Urbana-Champaign, November 2, 2017.
Disclaimer: We request all readers, electronic media and others follow our citation guidelines when re-posting articles from farmdoc daily. Guidelines are available here. The farmdoc daily website falls under University of Illinois copyright and intellectual property rights. For a detailed statement, please see the University of Illinois Copyright Information and Policies here.