








Consolidation Trends in the U.S. Nitrogen Fertilizer Industry
The conflict with Iran has renewed interest in the U.S. fertilizer industry and the impacts on pricing associated with increased consolidation. Domestic fertilizer production capacity is controlled by a relatively small number of manufacturers such that current Department of Justice guidelines would classify the U.S. fertilizer sector as highly concentrated.
This article examines trends in the domestic fertilizer industry, with a particular focus on nitrogen. We examine how consolidation among manufacturers has evolved over the past few decades and discuss its broader implications for U.S. agriculture.
U.S. Nitrogen Manufacturing Industry
U.S. agriculture accounts for approximately 10-15% of total global fertilizer consumption. US fertilizer demand is met through a mix of domestic production and imports, with the balance varying by nutrient type (see farmdoc daily, July 29, 2025). For potassium, the U.S. almost exclusively depends on imports from Canada and, to a much lesser extent, Russia. In contrast, the net import reliance for nitrogen and phosphate fertilizers is low —6% and 13% respectively— where domestic production is capable of meeting the majority of domestic demand.
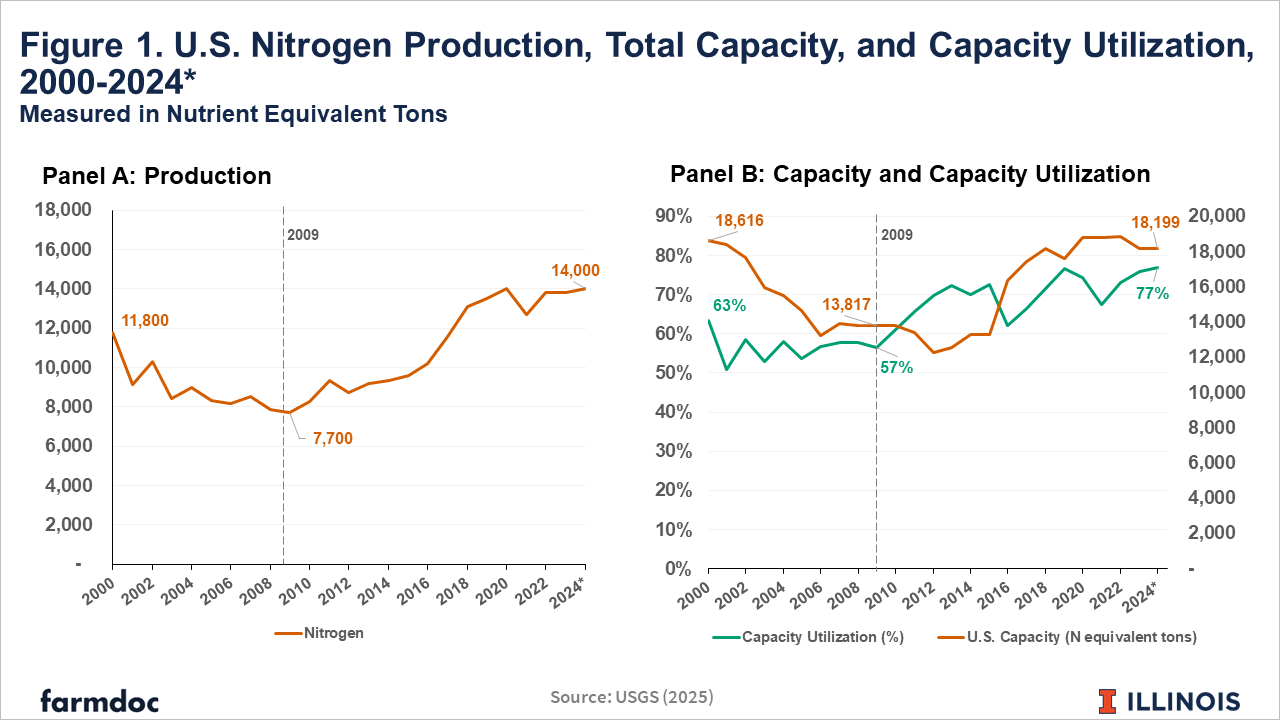
U.S. nitrogen production has increased 0.71% annually since 2000, reaching a projected 14,000 metric nutrient equivalent tons in 2024 (see Figure 1 and farmdoc daily, July 29, 2025). This increase in production has decreased the US’s reliance on imports which reached 6% in 2024, the lowest value since 2000.
The increase in production can be attributed to a mix of increasing production capacity and capacity utilization — measured as U.S. ammonia production divided by total ammonia production capacity. Figure 1 shows how both capacity and capacity utilization evolved from 2000 to 2024.
U.S. nitrogen production reached a low point in 2009 and has since increased (see Figure 1, panel A). Total capacity during this increasing production period increased from 13,817 to 18,199 tons, and capacity utilization increased from 57% to 77% (see Figure 1, panel B).
U.S. Nitrogen Manufacturing Consolidation
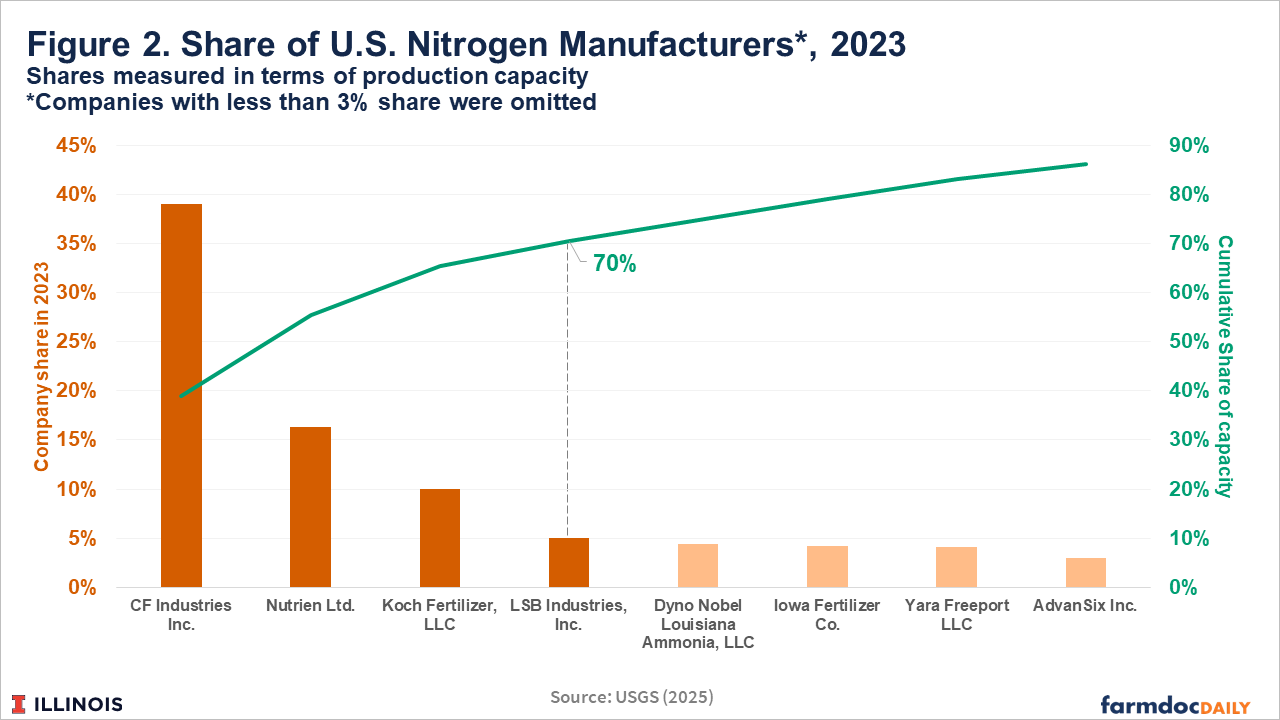
The U.S. fertilizer industry has also become significantly more consolidated. The number of plants has declined and the market share of the largest manufacturers has increased. From 2000 to 2023, the number of ammonia plants decreased from 46 to 33. In the same period, the market share of the top four companies — in terms of ammonia production capacity — increased from 50% to 70% in 2023. CF Industries Inc. is the clear leader, controlling 39% of current US domestic production capacity. They were followed by Nutrien Ltd., which owned 16% (see Figure 2).
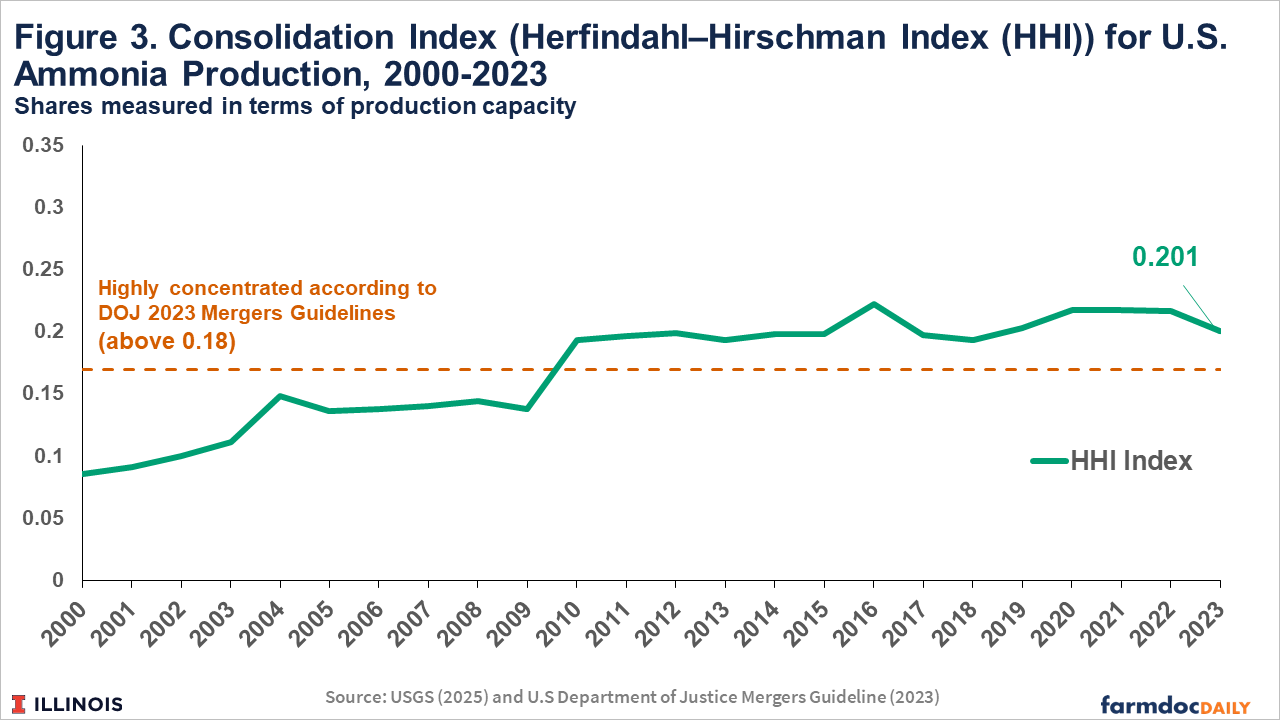
Further, to analyze the state of consolidation of the U.S. nitrogen fertilizer industry, the Herfindahl–Hirschman Index (HHI) is calculated considering the production capacity from 2000 to 2023. The HHI is a measure that accounts for the number of players and their respective shares in an industry. It is calculated as the sum of the squared shares of each player in an industry.
The U.S. Department of Justice (DOJ) and Federal Trade Commission (FTC) have guidelines and thresholds to classify the consolidation degree of an industry. According to the 2023 DOJ/FTC Merger Guidelines, an industry with a HHI higher than 0.18 (or 1,800 points) is considered highly concentrated. The DOJ/FTC guidelines are designed primarily to evaluate proposed mergers, not to determine whether an existing industry structure is necessarily harmful. The economic implications of high concentration depend on the broader market context, including entry barriers, import competition, regulation, pricing behavior, and political and strategic factors.
In 2023, the HHI for the nitrogen fertilizer manufacturing industry was 0.201 (or 2010 points). According to current DOJ guidelines, it is classified as highly concentrated (see Figure 3). It is important to note, however, that previous guidelines would have considered it as a moderately concentrated industry (prior to the 2023 update, the HHI threshold to be considered highly concentrated was 0.25 or 2,500 points).
Discussion
The previous section considered consolidation at the manufacturing level for nitrogen in the U.S., specifically based on ammonia production. Anhydrous ammonia is used directly as a fertilizer but also serves as the foundation for other nitrogen products such as urea and urea-ammonium nitrate (UAN) solutions (see farmdoc daily, February 17, 2021). Therefore, ammonia production capacity is a reasonable proxy for overall nitrogen manufacturing.
The domestic nitrogen fertilizer industry is considered highly concentrated under the 2023 DOJ/FTC Merger Guidelines, with a HHI of 0.201. The structure of the U.S. nitrogen industry is not new, as the share of the top 4 companies in terms of U.S. production capacity has been around 70% since 2003 (USGS, 2025).
Although this analysis focused on nitrogen, similar patterns of consolidation are evident in the phosphate and potash markets. In 2023, five mining companies operated nine active phosphate mines, compared to nine firms and 14 mines in 2002 (USGS, 2025). Two companies, Nutrien and Mosaic, control just over 89% of the potash production capacity in North America (Nutrien, 2024).
Furthermore, consolidation in agriculture is not unique to fertilizers. The top 4 companies in the soybean crushing, corn seeds, soybean seeds, and farm machinery sectors held 80%, 80%, 70% and 60.8% of the U.S. market share in 2024. Globally, the crop protection sector’s top 4 companies held 62% of the 2024 market share (Farm Action). Consolidation has not been limited to the input sector. Over time, the number of farms in the Midwest has also declined while production has increased (see farmdoc daily, July 29, 2024 and August 27, 2025). In 1987 large farms were responsible for operating 15% of all U.S. cropland, compared to 41% by 2017 (MacDonald, 2020).
It is also important to recognize that the fertilizer industry encompasses more than just manufacturers. The retail sector is more fragmented, but this upstream consolidation has important implications for the rest of the value chain, especially given that some manufacturers also have significant retail presence (i.e. Nutrien controls 21% of the U.S. retail industry (Nutrien, 2024)).
Consolidation is often viewed as a natural outcome of a mature industry. The fertilizer industry is mature, producing commodities that have remained largely unchanged over the past 40 years and varying little between firms in the sector. In this type of industry, one expects consolidation with low-cost producers surviving and higher-cost producers leaving the industry. One also expects prices to vary little across producers, and for those prices to be subject to global market events.
For farmers viewing the industry, consolidation presents issues in that all farms are relatively small compared to the firms supplying inputs in the industry. That may present fertilizer firms with market power that could impact product prices. Another area on which consolidation could have an impact is the potential for further expansion of production capabilities. If the small number of large firms has strengthened existing barriers to entry, it could be argued that the expansion of US production capacity since 2010 would have been even larger. Domestic production capability has become more important as countries have moved away from free trade. Moreover, regulations aimed at achieving environmental goals and addressing safety concerns will add costs which will ultimately be passed on to buyers and likely reinforce the barriers preventing more new entrants and further expansion of domestic production capacity.
Farmers are able to partially manage fertilizer price volatility through strategies that include adjusting application rates, timing, and forward pricing purchases (see farmdoc daily, July 22, 2025, August 12, 2025, and March 31, 2026). However, individual farmers have limited ability to address the structure of the industry and any of the potential negative impacts of consolidation.
Regulatory and policy actions to examine and address consolidation in the industry have been discussed and considered by lawmakers. These include providing more pricing transparency, removal of existing trade barriers such as tariffs and countervailing duties, mandating USDA conduct an analysis of the industry, and a Department of Justice investigation. Implementation of any of these initiatives would take time with uncertainty surrounding the ultimate impacts on the industry and prices paid by farmers for fertilizer products. Therefore, issues and concerns associated with consolidation likely will continue into future years.
References
Katchova, A., S. Baral, R. Ju and C. Zulauf. "Number of Farms and Land in Farms in the Midwest." farmdoc daily (14):140, Department of Agricultural and Consumer Economics, University of Illinois at Urbana-Champaign, July 29, 2024.
MacDonald, J. M. (2020, February). Consolidation in U.S. agriculture continues. Amber Waves. U.S. Department of Agriculture, Economic Research Service. https://www.ers.usda.gov/amber-waves/2020/february/consolidation-in-u-s-agriculture-continues
Monaco, H., N. Paulson and G. Schnitkey. "Factors Influencing Nitrogen Fertilizer Application Rates and Timing in Illinois." farmdoc daily (15):133, Department of Agricultural and Consumer Economics, University of Illinois at Urbana-Champaign, July 22, 2025.
Monaco, H., G. Schnitkey and N. Paulson. "U.S. Fertilizer Industry in Global Markets: Structure and Supply Risks." farmdoc daily (15):137, Department of Agricultural and Consumer Economics, University of Illinois at Urbana-Champaign, July 29, 2025.
Nutrien 2024 Annual Report. https://www.nutrien.com/api/resource/2024-annual-report
Paulson, N., G. Schnitkey, H. Monaco and C. Zulauf. "Fertilizer Decisions for the 2026 Crop Year." farmdoc daily (15):145, Department of Agricultural and Consumer Economics, University of Illinois at Urbana-Champaign, August 12, 2025.
Paulson, N., G. Schnitkey, C. Zulauf and L. Gentry. "High Fertilizer Prices Suggest Reconsidering Application Rates." farmdoc daily (16):54, Department of Agricultural and Consumer Economics, University of Illinois at Urbana-Champaign, March 31, 2026.
U.S. Department of Justice & Federal Trade Commission. (2023, December 18). 2023 Merger Guidelines. Antitrust Division, U.S. Department of Justice. https://www.justice.gov/atr/2023-merger-guidelines
U.S. Geological Survey. (n.d.). Nitrogen statistics and information. National Minerals Information Center. Retrieved August 28, 2025, from https://www.usgs.gov/centers/national-minerals-information-center/nitrogen-statistics-and-information
U.S. Geological Survey. (n.d.). Phosphate‑rock statistics and information. National Minerals Information Center. Retrieved August 28, 2025, from https://www.usgs.gov/centers/national-minerals-information-center/phosphate-rock-statistics-and-information
Sellars, S. and V. Nunes. "Synthetic Nitrogen Fertilizer in the U.S." farmdoc daily (11):24, Department of Agricultural and Consumer Economics, University of Illinois at Urbana-Champaign, February 17, 2021.
Zulauf, C., J. Colussi, G. Schnitkey and N. Paulson. "Grains and Oilseeds: Part 2 – United States." farmdoc daily (15):156, Department of Agricultural and Consumer Economics, University of Illinois at Urbana-Champaign, August 27, 2025.
Disclaimer: We request all readers, electronic media and others follow our citation guidelines when re-posting articles from farmdoc daily. Guidelines are available here. The farmdoc daily website falls under University of Illinois copyright and intellectual property rights. For a detailed statement, please see the University of Illinois Copyright Information and Policies here.