


The Clean Fuel Production Tax Credit (45Z), Part 2: Carbon Intensity
As discussed previously, the Clean Fuel Production Tax Credit, or Section 45Z, is a tax credit for biofuel producers, not a direct payment or benefit to farmers (farmdoc daily, May 27, 2026). The policy matters to corn and soybean growers because the value of the tax credit depends on the carbon intensity of the final biofuel product. That creates a strong incentive for biofuel producers to lower carbon intensity as much as possible, and one important way to do that is by sourcing grain with a lower feedstock carbon intensity score. In this sense, 45Z may create a new kind of market signal for agriculture: corn or soybeans with lower documented carbon intensity could be viewed by biofuel producers as a higher-value input than grain with a higher carbon footprint. This basic market logic is the reason farmers should pay attention to how feedstock carbon intensity is defined and measured. In this article, we discuss some common issues regarding what a feedstock carbon intensity score means and how it may be calculated.
This article addresses three questions. First, what does it actually mean for a corn or soybean crop to have a carbon intensity score? In general, that score can be understood as a measure of the greenhouse gas emissions associated with producing the crop, expressed relative to the amount of crop produced. Second, which farm practices may count toward lowering that score under the current 45Z policy? To answer that question, we look closely at the USDA’s Feedstock Carbon Intensity Calculator (USDA, FD-CIC), which is the spreadsheet-based tool developed to estimate feedstock carbon intensity for 45Z specifically. Third, how much can the recognized carbon intensity benefit from the same practice differ across Illinois counties? To make that question concrete for farmers, we use a set of Illinois county maps showing the carbon intensity reductions currently recognized by the FD-CIC under different conservation practices.
What Does CI Score Mean?
Under USDA’s technical guidelines (ICF International 2025, USDA OCE 2025), carbon intensity (CI) for biofuel feedstock crops is defined as “a measure of GHG performance reflecting the estimated quantity of GHG emissions associated with one unit of production,” and for feedstock crops it is expressed as grams of carbon dioxide equivalent per bushel produced. In practical terms, that means a crop CI score is an estimate of the greenhouse gas emissions associated with producing one bushel of the crop.
Figure 1 illustrates crop carbon intensity (CI) as the ratio of cradle-to-farm-gate greenhouse gas (GHG) emissions per acre to crop yield per acre, expressed in grams of CO₂ equivalent per bushel. In this framework, cradle-to-farm-gate emissions include major sources such as soil carbon emissions, nitrous oxide (N₂O) emissions, upstream emissions from fertilizer and other chemical inputs, and on-farm energy use. Soil carbon emissions refer to changes in soil organic carbon, meaning whether farming practices cause the soil to lose carbon or, in some cases, store more of it (e.g., negative soil carbon emissions). Nitrous oxide emissions are mainly associated with nitrogen cycling in soils and are often influenced by fertilizer use. Upstream emissions from fertilizer and other chemical inputs refer to the emissions generated before those products ever reach the farm, especially during manufacturing and transportation. On-farm energy use refers to carbon dioxide emissions from fuel and energy consumed in farm operations. A short but important note is that, under the current 45Z framework (91 FR 5160), emissions attributed to indirect land-use change (often known as iLUC) are excluded from the emissions calculation. In other words, the CI discussion here is focused on emissions tied more directly to crop production and input use, rather than broader market-mediated land-use effects.
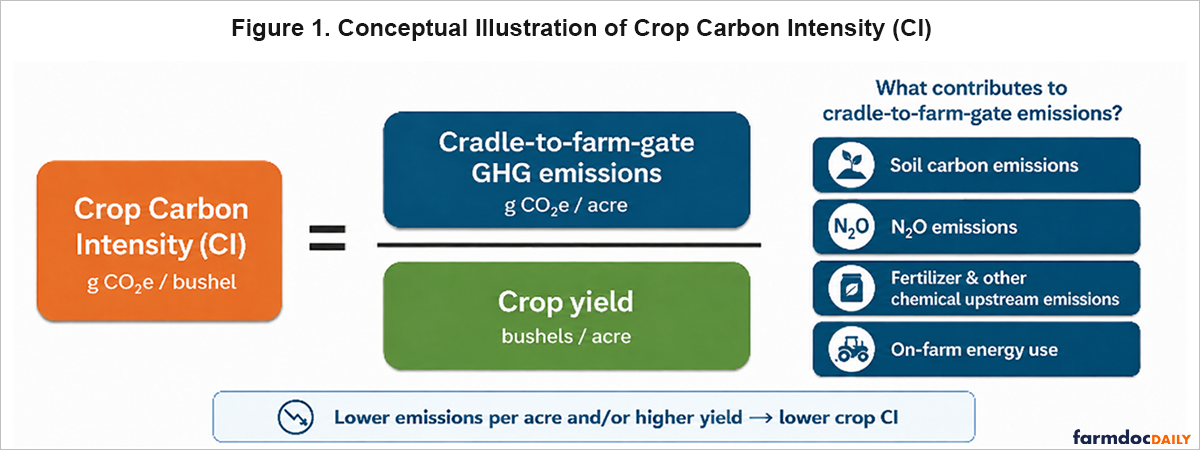
The formula for CI also suggests two broad ways to lower a CI score: one is to reduce cradle-to-farm-gate emissions per acre, and the other is to increase crop yield so that emissions are spread over more bushels. For example, cover crops are often discussed as a practice that can reduce soil carbon loss and, under some conditions, even increase soil organic carbon storage. At the same time, the yield side cannot be ignored. Researchers (Qin, Kaiyu et al. 2023; Lobell, Di Tommaso et al. 2025) find that non-legume cover crops can reduce maize yield in some cases, even though soybean yield effects are not statistically significant on average. That is why the impact of any conservation practice on CI is not always straightforward. If a practice lowers emissions but also reduces yield, the net effect on CI becomes more complicated, and under some conditions a practice could even raise CI if the yield penalty is large enough.
Which Practices Lower CI Scores?
In principle, any management change that lowers emissions per acre or raises yield could lower a crop’s CI score. Under the current 45Z-related USDA framework, however, only a limited set of practices are actually recognized in the Feedstock Carbon Intensity Calculator (FD-CIC): no till, reduced till, cover crops, nitrification inhibitors, split in-season fertilizer application (corn and sorghum only), and spring-only fertilizer application (corn only). From the producer’s perspective, these present important limitations: not every conservation or management practice that may reduce emissions or increase yields will count for 45Z purposes. What matters here is not simply whether a practice is “good” but whether it is one of the practices currently included in the USDA’s FD-CIC framework.
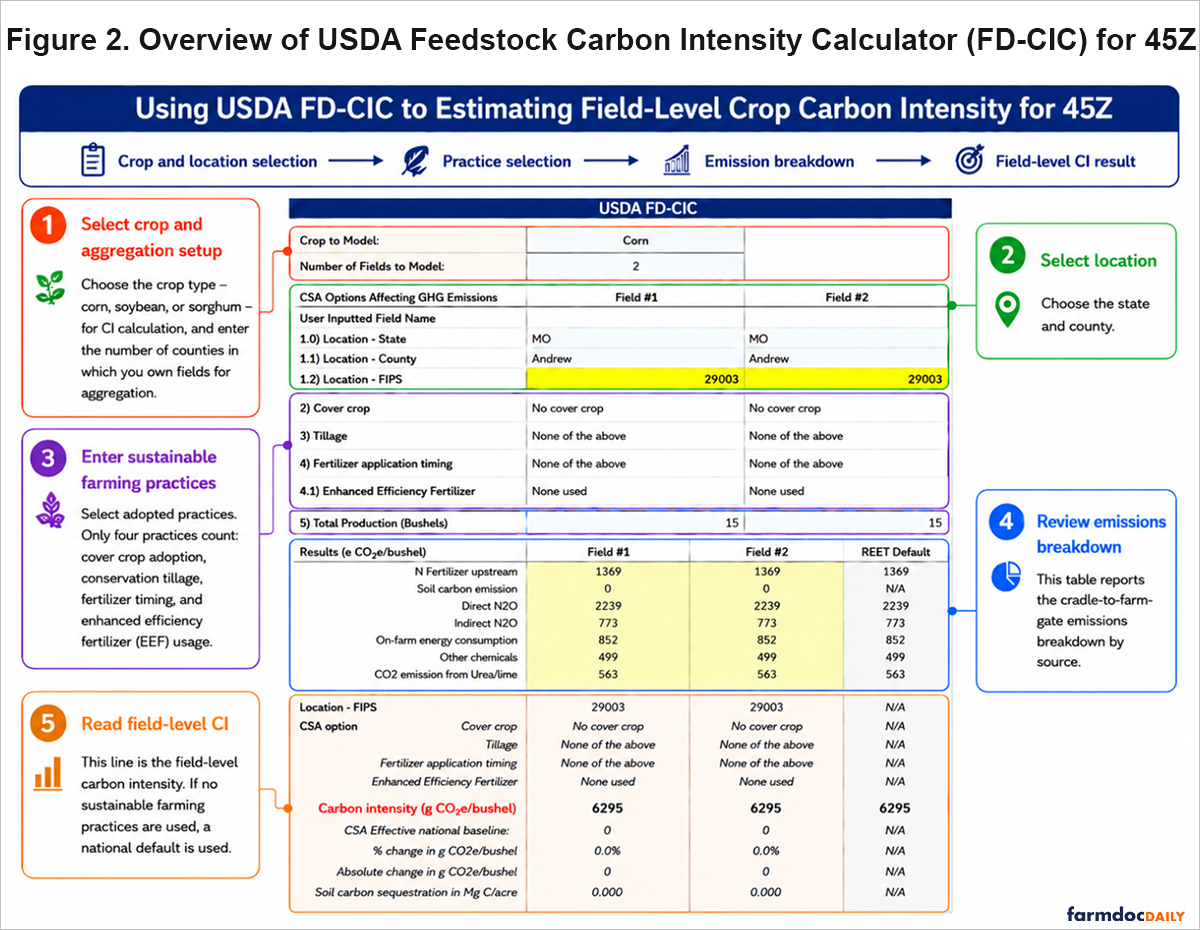
Figure 2 shows how the USDA FD-CIC is currently set up to estimate field-level crop CI for 45Z. Interested readers can download the USDA FD-CIC spreadsheet tool and user manual from USDA’s website (https://www.usda.gov/usda-fdcic) to explore how the calculator works and to test their own crop, county, and practice combinations. The user first selects the crop and the number of fields to model, then enters the state and county for each field, selects any recognized practices, reviews the emissions breakdown by source, and reads the resulting field-level CI at the bottom of the table, with GREET default values shown for reference. Although the spreadsheet also asks the user to enter total production in bushels for each field, that information is used only as a weight to average CI scores across individual fields into a whole-farm weighted average. In other words, the current FD-CIC tool changes only the emissions side of the calculation. It does not separately model how a practice might increase or decrease yield. This simplifies the analysis because producers do not need to worry that a possible yield penalty from a conservation practice will reduce the credit recognized in the calculator. It also means, however, producers are not rewarded in the tool for yield gains that may result from better management.
A final note of caution is important. USDA describes the current FD-CIC as a beta version released for testing, peer review, and public feedback and states that users should treat its values as preliminary until final action is taken. That means farmers should not assume that the current numbers, practice definitions, or supporting documentation expectations are fully settled. At the same time, existing USDA guidance already points clearly toward recordkeeping: producers using FD-CIC are expected to maintain documentation of tool inputs and outputs, and the broader technical guidelines describe practice-specific records that may be needed to verify implementation.
How Much Does Location Matter?
Location matters because the CI reduction recognized under the current FD-CIC framework is not determined only by the practice itself. Different practices generate different levels of CI reduction relative to the GREET default value for corn, set at 6,295 g CO₂e per bushel, and the same practice can generate different reductions when applied in different counties. If the goal is to maximize CI reduction, producers should consider both which practices are recognized under 45Z and which of those practices generate the largest recognized reductions locally.
Figure 3 illustrates this point using county-level maps for Illinois corn under four selected management scenarios: cover crops, no-till, split in-season nitrogen application, and nitrification inhibitor use. All county-level values shown in the maps were retrieved by the authors from the current version of USDA’s FD-CIC tool. In each panel, CI reduction is measured relative to the GREET default, and darker green shading indicates a larger reduction. The figure shows clearly that both practices and locations matter. First, the size of the recognized CI reduction differs substantially across practices. Cover crops show the largest estimated reductions, followed by no-till, while split in-season nitrogen and nitrification inhibitor use produce much smaller reductions in this Illinois corn case. Second, even within the same practice, the recognized reduction is not uniform across counties. For cover crops, for example, the estimated reduction ranges from about 1,174 to 3,137 g CO₂e per bushel, with some southern counties showing noticeably larger reductions than many counties in central and northern Illinois.
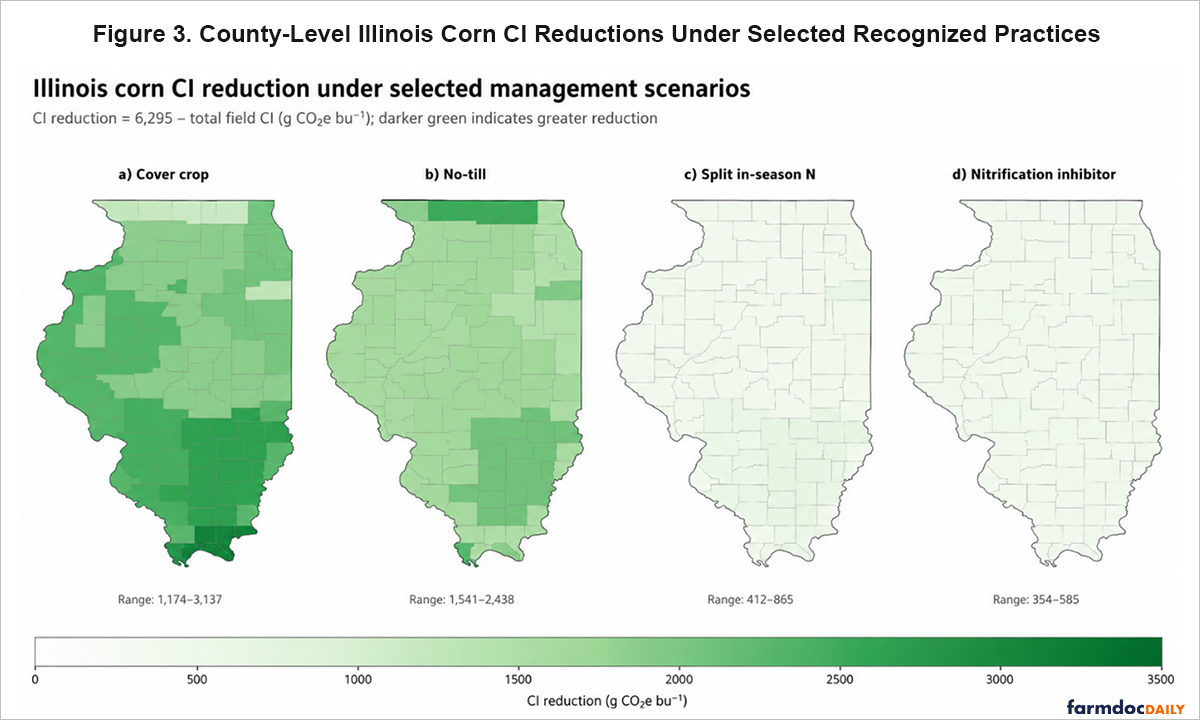
The purpose of this comparison is not to explain every county-level difference in the map, but to make one practical point clear: the CI reduction due to a recognized practice is not the same everywhere. A practice that produces a relatively large, recognized reduction in one county may generate a more modest reduction in another. That does not mean a producer should choose practices based only on the map, since agronomic fit, cost, and management feasibility still matter. But it does suggest that, under the current FD-CIC framework, location can affect the size of the recognized CI benefit and therefore may also affect the size of the potential 45Z-related marketing opportunity.
Concluding Thoughts
Carbon intensity, at its core, is a way of estimating the amount of greenhouse gas emissions associated with producing a bushel of grain. For producers interested in 45Z, the practical takeaway from this article is threefold. First, a lower feedstock CI score could matter because it may make grain more attractive to biofuel producers seeking to reduce biofuel carbon intensity. Second, under the current 45Z-related FD-CIC framework, only a limited set of practices are recognized: no-till, reduced till, cover crops, nitrification inhibitors, split in-season fertilizer application, and spring-only fertilizer application. Other practices may still have agronomic or environmental benefits, but they are not currently counted in the tool for 45Z purposes. And for recognized practices, their official definitions, documentation requirements, and verification rules are still being finalized. Third, the recognized CI benefit from a practice can differ across counties, so location matters when estimating the potential value of low-CI grain. Together, these points help clarify what kinds of information will likely be needed before a low-CI grain market can function in a practical way.
The next article in this series will move from CI reduction measures to farm economics and decision support. If a recognized practice lowers feedstock CI, how much total 45Z tax-credit value could that create, and what might that mean for farm revenue? The first question is about the size of the cake, while the second is about whether any of that cake is actually shared with the farmer. Based on the answers to these farm economic questions, the next article will also discuss what practical steps producers can take now to prepare for potential 45Z market opportunities.
References
Coppess, J., and Z. Chen. “The Clean Fuel Production Tax Credit (45Z); Introductory Discussion.” farmdoc daily (16):92, Department of Agricultural and Consumer Economics, University of Illinois at Urbana-Champaign, May 27, 2026. https://farmdocdaily.illinois.edu/2026/05/the-clean-fuel-production-tax-credit-45z-introductory-discussion.html.
Department of the Treasury, Internal Revenue Service. “Section 45Z Clean Fuel Production Credit.” Federal Register 91 FR 5160–5207, February 4, 2026. Proposed rule.
ICF International. Methodology for Determining the Feedstock Carbon Intensity of Climate Smart Agriculture Practice Adoption in USDA FD-CIC. White Paper. January 2025.
Lobell, D. B., S. Di Tommaso, Q. Zhou, Y. Ma, J. Specht, et al. “The Mixed Effects of Recent Cover Crop Adoption on US Cropland Productivity.” Nature Sustainability 8 (2025): 1004–1012. https://doi.org/10.1038/s41893-025-01599-5.
Qin, Z., K. Guan, W. Zhou, B. Peng, J. Tang, Z. Jin, R. Grant, T. Hu, M. B. Villamil, E. DeLucia, A. J. Margenot, U. Mishra, Z. Chen, and J. Coppess. “Assessing Long-Term Impacts of Cover Crops on Soil Organic Carbon in the Central US Midwestern Agroecosystems.” Global Change Biology 29(9) (2023): 2572–2590. https://doi.org/10.1111/gcb.16632.
U.S. Department of Agriculture, Office of the Chief Economist. Technical Guidelines for Climate-Smart Agriculture Crops Used as Biofuel Feedstocks. 7 CFR Part 2100, interim rule, effective January 17, 2025.
U.S. Department of Agriculture. USDA Feedstock Carbon Intensity Calculator. USDA website. https://www.usda.gov/usda-fdcic
U.S. Department of Agriculture. USDA FD-CIC User Manual. January 2025. https://www.usda.gov/sites/default/files/documents/USDA_FDCIC_UserManual_Jan2025.pdf
Disclaimer: We request all readers, electronic media and others follow our citation guidelines when re-posting articles from farmdoc daily. Guidelines are available here. The farmdoc daily website falls under University of Illinois copyright and intellectual property rights. For a detailed statement, please see the University of Illinois Copyright Information and Policies here.