


ECO and SCO in Illinois in 2025
The Risk Management Agency (RMA) of the USDA recently released the 2025 actual county yields needed to calculate payments for area-based insurance plans including the Enhanced and Supplemental Coverage Options (SCO and ECO). Yield losses were shown to be sufficient to trigger payments on yield-based ECO and SCO coverage in many areas across the US for non-irrigated corn, soybean, and wheat acres. Given the harvest prices for corn, soybeans, and wheat were below the projected prices for 2025, an even larger number of counties triggered revenue-based ECO and SCO payments.
Today’s article focuses on 2025 ECO and SCO experience for corn, soybeans, and wheat in Illinois, assuming underlying revenue coverage. ECO and SCO payments were concentrated in southern Illinois for corn and soybeans, with some counties also triggering payments in the central and northern parts of the state. In areas where ECO at a 95% coverage level (ECO-95) triggered payments, they were typically larger than the premium paid by farmers, resulting in a positive net benefit.
Insurance Choices in Illinois
More than 19.5 million acres of corn, soybeans, and wheat in Illinois were insured using the COMBO policies (RP, RP-HPE, or YP) in 2025. The vast majority of those acres were insured using RP (96.7%), with much smaller shares insured using RP-HPE (1.3%) or YP (1.9%).
Farmers in Illinois used ECO on nearly 6.1 million acres in 2025. Nearly 6 million of those acres had underlying RP coverage, accounting for 31.7% of the nearly 19 million acres insured with RP. 73,000 acres carried ECO with underlying RP-HPE coverage, or 27.7% of total RP-HPE acres. Just under 19,000 acres used ECO with YP coverage, or 5% of total acres insured with YP. ECO at the 95% coverage level (ECO-95) was the clear preference among producers – just 4% of acres carrying ECO coverage elected the 90% coverage level.
SCO coverage had much lower levels of use: only 2% of RP acres used SCO; 0.3% of RP-HPE acres and 0.1% of YP acres used SCO.
Given the vast majority of insured acres in Illinois use RP, and the use of ECO and SCO are significantly higher on acres with an underlying revenue policy, we focus on revenue-based ECO and SCO payments in the following sections. The ECO payments reported in the figures and tables are for a farm whose APH yield is the same as the expected yield for its county. In practice, actual payment rates for farms in counties where payments were triggered will vary based on their individual APH yields.
In 2025, revenue-based ECO-95 covered county revenue losses from 95% down to 86%. ECO-90 covered losses from 90% down to 86%, and SCO covers county losses from 86% down to the selected underlying product coverage. For instance, SCO+RP-70% would cover from 86% down to 70% of county losses.
ECO and SCO for Corn
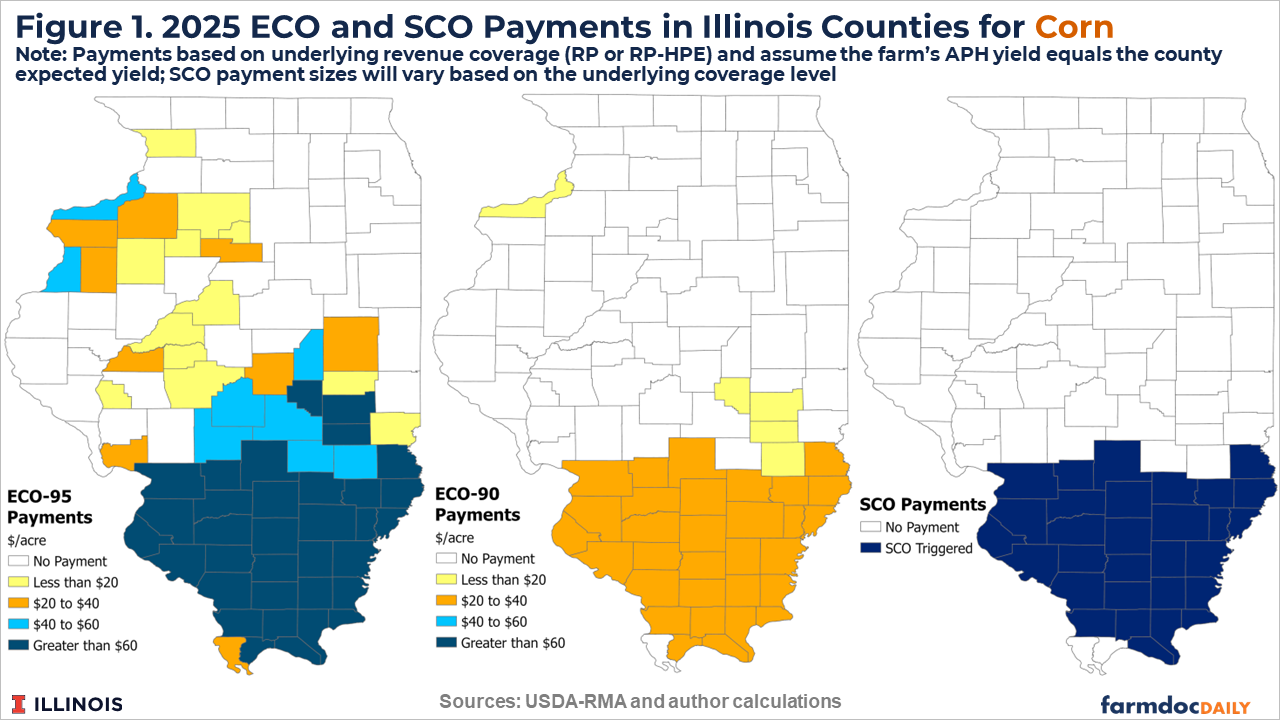
The 2025 harvest insurance price for corn was $4.22 per bushel, 10.2% below the projected price of $4.70. This means that ECO-95 payments were triggered in counties that had actual yields as high as 5.8% above their expected yields. ECO-90 payments triggered for counties with yields at or below their expected yields; SCO required yields to be at least 4.2% below the expected yield.
Revenue-based ECO payments were triggered for non-irrigated corn in most of southern Illinois and parts of central and northern Illinois for 2025 (see Figure 1). ECO-95 was triggered in 63 Illinois counties, with an average payment in those counties of $52 per acre (left panel of Figure 1). ECO-90 payments were triggered in 36 counties, averaging nearly $30 per acre (middle panel of figure 1). Losses were sufficient to trigger SCO payments in 30 counties in Illinois, all in the southern region of the state (right panel of Figure 1).
Tables reporting the payment rates for ECO-95 and ECO-90 for non-irrigated corn, for all Illinois counties are available here: 2025 ECO SCO Illinois. Tables are also provided for non-irrigated soybeans and wheat, which are summarized in the following sections.
ECO and SCO for Soybeans
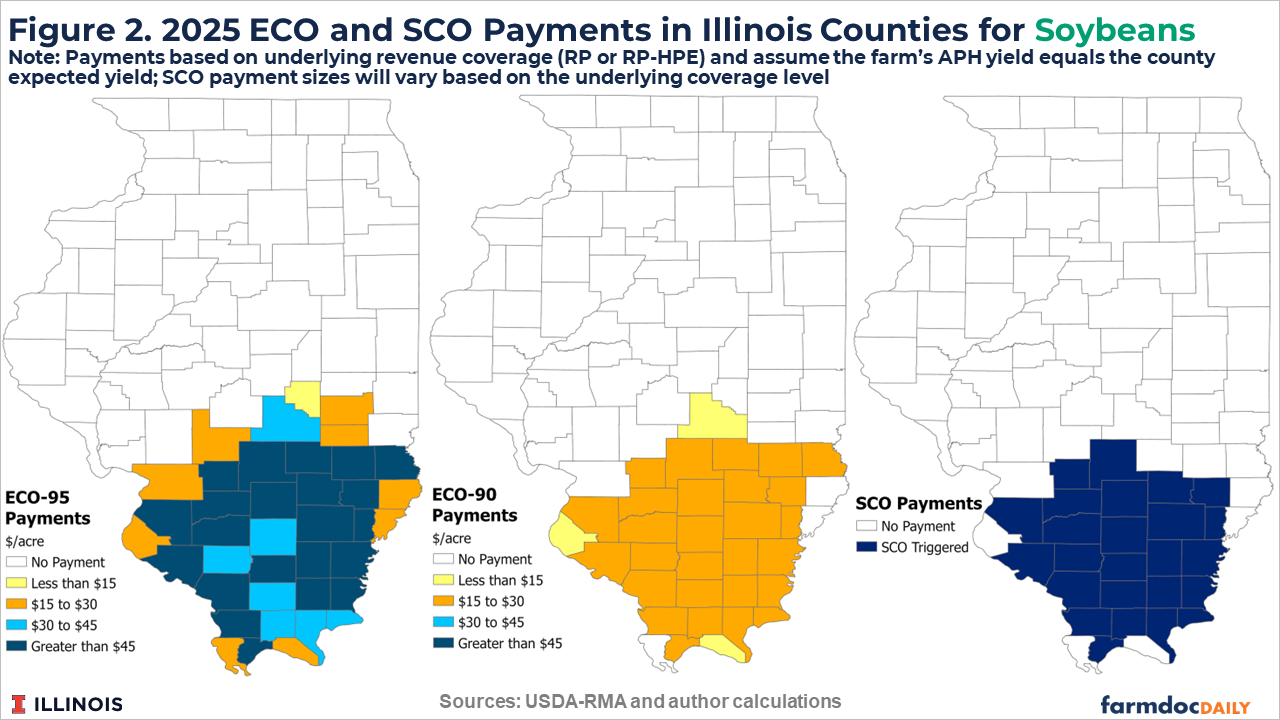
The 2025 harvest insurance price for soybeans was $10.35 per bushel, 1.8% below the projected price of $10.54. This means that ECO-95 payments were triggered in counties that had soybean yield losses of at least 3.3% below expected yields. ECO-90 payments triggered for counties with yields at least 8.3% below expected yields; SCO required yields to be at least 12.4% below the expected yield.
Illinois counties triggering ECO and SCO payments for non-irrigated soybeans in 2025 were all in the southern half of the state (see Figure 2). A total of 39 Illinois counties triggered ECO-95 payments, with an average payment rate of $41 per acre (left panel of Figure 2). ECO-90 was triggered for 31 counties, averaging $19 per acre (middle panel of Figure 2). 30 counties in southern Illinois had soybean revenue losses sufficient to trigger an SCO payment in 2025 (right panel of Figure 2).
ECO and SCO for Wheat
The 2025 harvest insurance price for wheat was $5.27 per bushel, 8.3% below the projected price of $5.75. This means that ECO-95 payments were triggered in counties that had actual wheat yields as high as 3.7% above their expected yields. ECO-90 payments triggered for counties with wheat yields at least 1.8% below expected yields; SCO required wheat yields to be at least 6.2% below the expected yield.
Only two Illinois counties triggered ECO payments for non-irrigated wheat in 2025. Gallatin county in southern Illinois triggered a $29.47 per acre payment for ECO-95 and a $4.35 per acre payment for ECO-90. Jo Daviess county in northwestern Illinois triggered maximum ECO-95 and ECO-90 payments of $43.37 and $19.27 per acre, respectively. The revenue loss for Jo Daviess was also sufficient to trigger an SCO payment with actual county revenue of $370 per acre, or 77% of the $482 per acre expected revenue.
Net Benefits for Corn and Soybeans
Figure 3 shows the average net benefit (payments minus farmer-paid premium) for ECO-95 coverage in 2025 for non-irrigated corn (left panel) and soybeans (right panel).
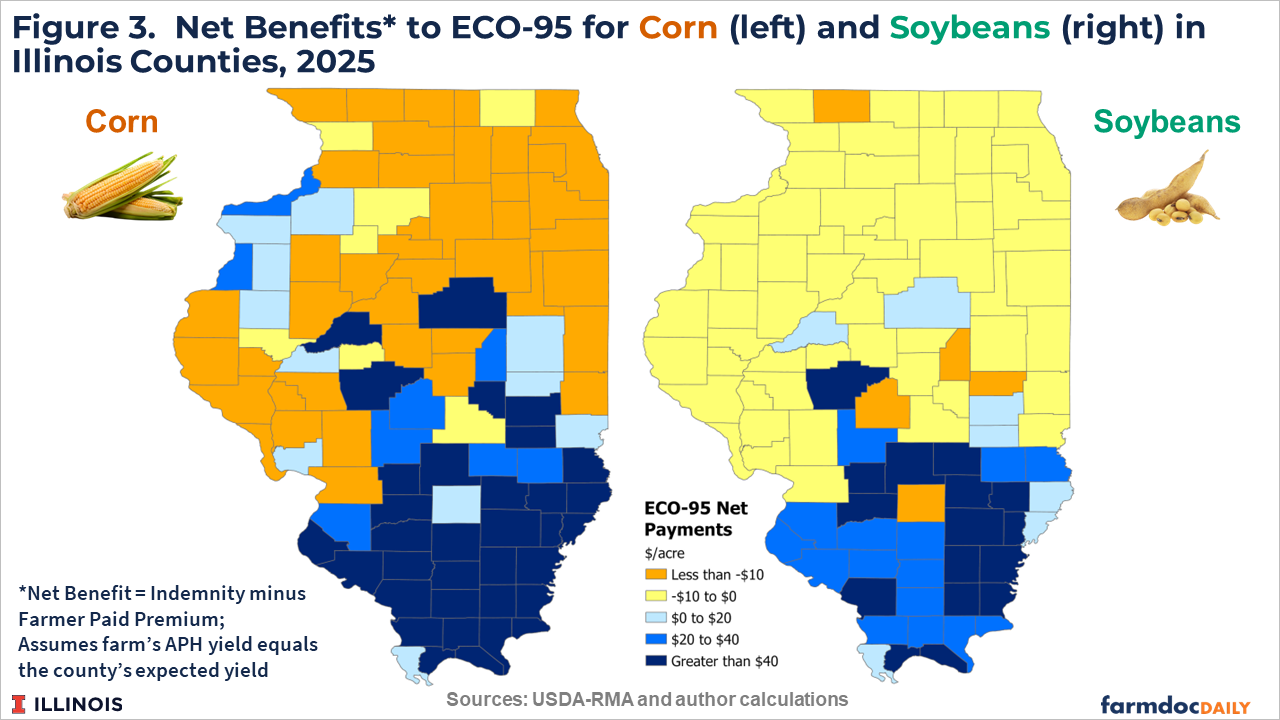
Counties in orange and yellow had negative net benefits, implying no ECO-95 payment was triggered or the payment was smaller than the premium the farmer paid for the coverage. These include most counties in northern Illinois and a number of counties across central Illinois for corn. All northern Illinois counties and most central Illinois counties realized a negative net benefit to ECO-95 for soybeans.
Counties in blue realized a positive net benefit to ECO-95 in 2025, meaning a payment was triggered that was larger than the premium paid by the farmer. Most counties realizing a net benefit for ECO-95 coverage for corn and soybeans in 2025 were in southern Illinois. A few central Illinois counties collected payments that exceeded their premium cost in central Illinois.
A total of 53 counties realized a positive net benefit for ECO-95 coverage on corn acres, with an average net benefit of $36 per acre. A total 38 counties realized a positive net benefit for ECO-95 coverage on soybean acres, with an average net benefit of $33 per acre.
Summary
Revenue-based ECO and SCO coverage triggered payments in a number of Illinois counties for non-irrigated corn and soybean acres in 2025. ECO-90 and SCO payments were concentrated in counties in the southern region of Illinois. ECO-95 payments were also triggered in some counties in central Illinois and northern Illinois for corn.
In counties where payments were triggered, ECO-95 payments averaged $52 per acre for corn and $41 per acre for soybeans. In counties where ECO-90 was triggered, payments averaged $30 and $19 per acre for corn and soybeans, respectively.
In most counties where payments were triggered, they exceeded the premium cost paid by the farmer generating a positive net benefit. For 2025, the subsidy rate on ECO and SCO premiums was 65%. This was increased to 80% for the 2026 crop year, meaning that premiums were lower and net benefits would be higher under similar loss conditions as 2025.
References
Paulson, N., H. Monaco, G. Schnitkey and C. Zulauf. "2025 RMA County Yields and ECO/SCO Payments." farmdoc daily (16):105, Department of Agricultural and Consumer Economics, University of Illinois at Urbana-Champaign, June 16, 2026.
Disclaimer: We request all readers, electronic media and others follow our citation guidelines when re-posting articles from farmdoc daily. Guidelines are available here. The farmdoc daily website falls under University of Illinois copyright and intellectual property rights. For a detailed statement, please see the University of Illinois Copyright Information and Policies here.