








Harvest Price Option (HPO) Is Extremely Popular With Farmers but Is It Good Policy?
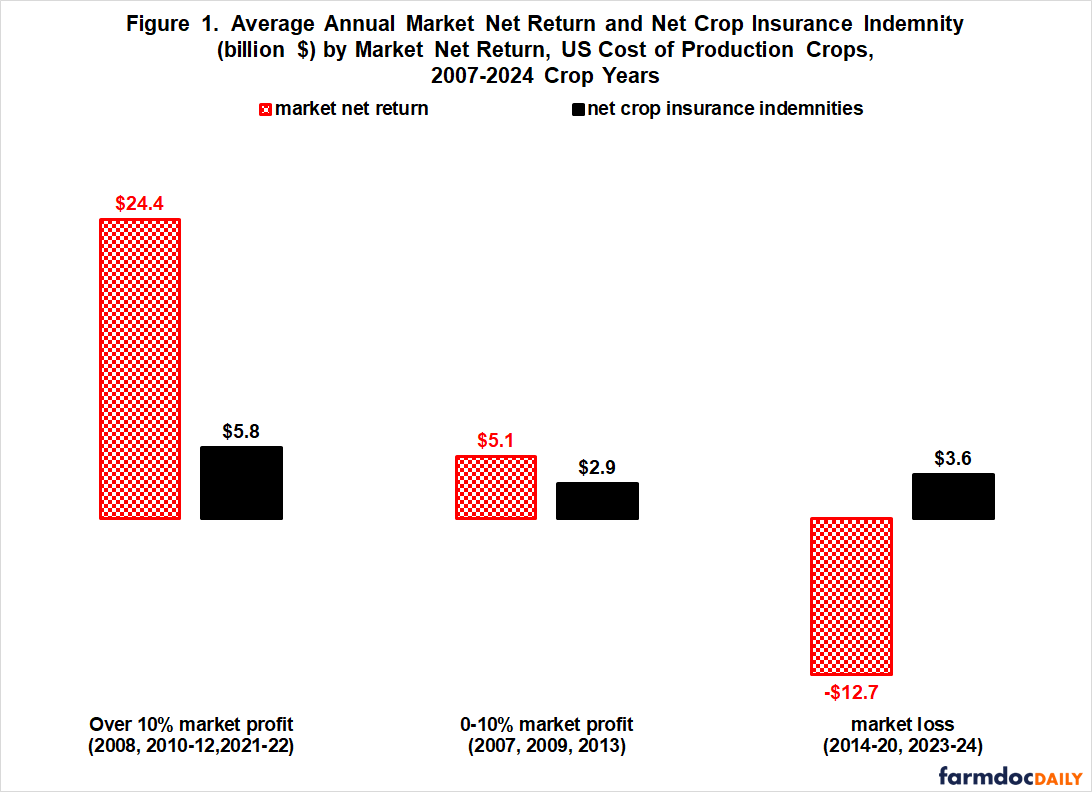
Making government payments when crop production is profitable supercharges profits, putting upward pressure on input prices and in turn increasing the likelihood of future demand for, and increases in, government assistance. Since 2007, or the US biofuel era, crop insurance has paid on average $2.2 billion more to crop farmers in years of double-digit profits relative to costs than in years with market losses (see Figure 1). In the double-digit profit year, net indemnities added an average of $5.8 billion to average market profits of $24.4 billion. While extremely popular with farmers, HPO (Harvest Price Option) plays a central role. Eliminating premium subsidies for HPO would notably reduce the supercharging of profits when crops are profitable; in turn, reducing the upward pressure on crop farmers’ production costs and taxpayers’ federal budgetary costs.
Data and Procedures
Market net return in Figure 1 is from the US Department of Agriculture, Economic Research Service. USDA, ERS calculates market return at harvest net of the economic cost of production (COP), including an opportunity cost for unpaid family labor and owned land. Calculations are made for barley, corn, cotton, oats, peanuts, rice, sorghum, soybeans, and wheat. Insurance payments are net of farm-paid premiums. They are calculated using data from USDA, RMA (Risk Management Agency). Because crop insurance premiums are publicly subsidized, farmers as a group usually receive more indemnities than the premiums they pay. Combined net return and combined net indemnities to the nine COP crops are used in this article. For a more detailed discussion of the data in Figure 1, see farmdoc daily, February 5, 2026.
HPO
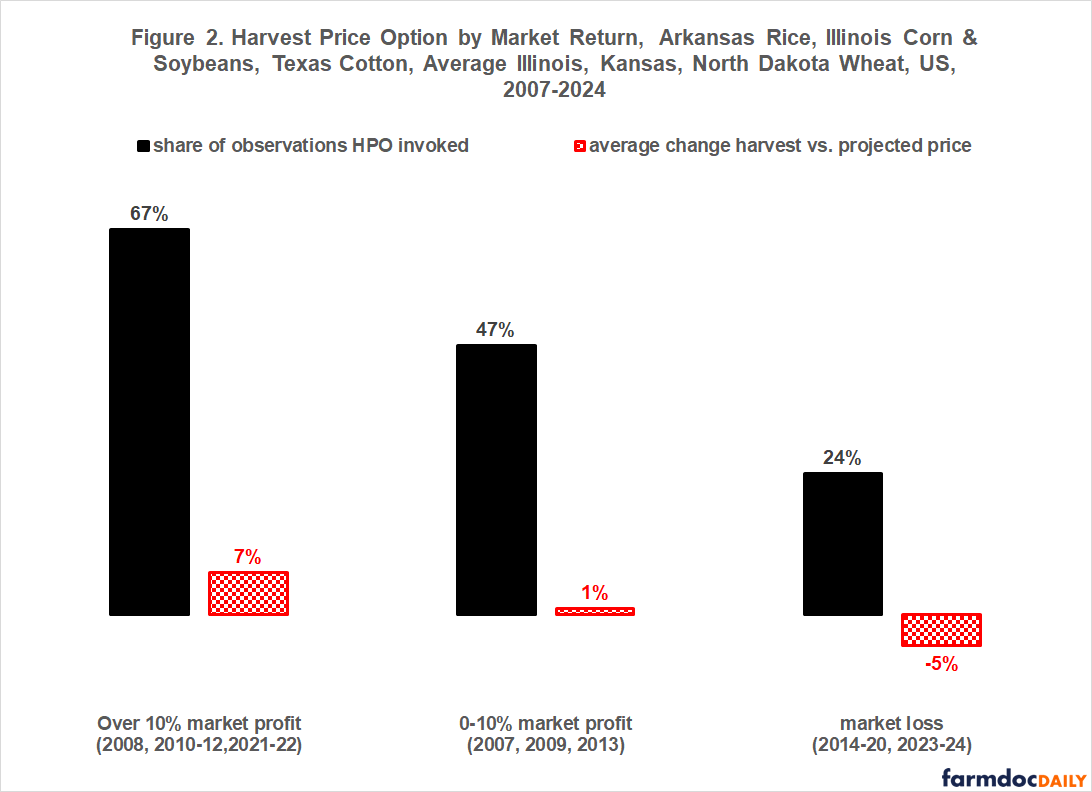
HPO is invoked when the insurance price is higher in the harvest than in the pre-planting price discovery period, resulting in the harvest price being used to set the insured liability. HPO was invoked in 67% of the 30 crop-by-year observations for Arkansas rice, Illinois corn and soybeans, Texas cotton, and the average of Illinois-Kansas-North Dakota wheat during the six years with more than a 10% market profit relative to the cost of production for the nine COP crops combined (see Figure 2). The comparable share was 24% of the 45 observations in the nine years of market loss for the COP crops. These shares are consistent with economic principles, which imply that higher prices translate into higher profits, assuming no other factors change. RMA reports prices by crop, state, crop type, and practice. The states used in Figure 2 are large, often the largest, producer of the crop. Their insurance price is also often the insurance price for other large producing states. Prices are for conventional production practice.
Discussion
HPO is extremely popular with farmers (see farmdoc daily, November 17, 2020 and December 17, 2024). In 2025, RP (Revenue Protection with HPO) was purchased for 214 million acres vs. 15.7 million acres for Yield Protection and less than 1 million acres for RP-HPE (Revenue Protection without HPO).
Popularity however does not necessarily equate to good policy, even if the perspective is only farmers.
Since 2007, crop insurance has made higher payments to farmers when crop production is double-digit profitable, which is contrary to common understanding of a safety net.
HPO is a key reason. Simply put, a higher price at harvest (i.e. HPO is invoked) translates into higher profits, other factors remaining the same.
Eliminating premium subsidies for HPO would reduce crop insurance’s supercharging of profits in profitable years, which would reduce the upward pressure on crop production costs in future years.
Federal budget savings would also be sizable. To provide a rough indication, average subsidy per insured acre was computed for RP and RP-HPE for the 2011-2025 crop years for barley, corn, cotton, rice, sorghum, soybeans, and wheat. Average premium subsidy was $29 per RP insured acre vs. $18 per RP-HPE insured acre. Assuming farmers would switch from RP to RP-HPE at the same coverage level, multiplying the $11 difference ($29-$18) by RP insured acres in 2025 for the seven crops (206 million) suggests $2.3 billion in premium subsidy savings per year, or $23 billion in a 10-year CBO (Congressional Budget Office) score.
This paper’s perspective is the field crop sector, not the individual crop or farmer. Aggregate impact of policy is often overlooked but is critical for the future profitability of individual farmers and crops. In particular, the field crop sector perspective, or average field crop acre perspective, matters when considering input prices, including land prices. Few farmers raise only one crop, and crops compete with one another for land and often substitute or complement one another in use. If the sector is profitable, whether due to market returns or government payments, upward pressure will exist on crop input prices, with higher prices likely to persist for more than one year. Aggregate impact matters.
References
Schnitkey, G., N. Paulson, C. Zulauf and K. Swanson. "Revenue Protection: The Most Used Crop Insurance Product." farmdoc daily (10):198, Department of Agricultural and Consumer Economics, University of Illinois at Urbana-Champaign, November 17, 2020.
Schnitkey, G., N. Paulson and C. Zulauf. "Update on Historic Use of Crop Insurance Products in Illinois." farmdoc daily (14):228, Department of Agricultural and Consumer Economics, University of Illinois at Urbana-Champaign, December 17, 2024.
U.S. Department of Agriculture, Risk Management Agency. 2026. “Price Discovery.” Accessed July 2026. http://www.rma.usda.gov
Zulauf, C., D. Orden and G. Schnitkey. "Has the US Crop Safety Net Become Excessive?" farmdoc daily (16):18, Department of Agricultural and Consumer Economics, University of Illinois at Urbana-Champaign, February 5, 2026.
Disclaimer: We request all readers, electronic media and others follow our citation guidelines when re-posting articles from farmdoc daily. Guidelines are available here. The farmdoc daily website falls under University of Illinois copyright and intellectual property rights. For a detailed statement, please see the University of Illinois Copyright Information and Policies here.