








Crop Insurance Loss Performance and Impacts on Farmer Net Support by Crop
A recent farmdoc daily article (July 21, 2026) provided an analysis of the performance of the federal crop insurance program in 2025, discussing how it was “typical” when compared to performance over the past 20 years. This article further evaluates the impact of the program’s longer-term performance on the net insurance support received by producers who use crop insurance and how that varies by crop and region.
Net Crop Insurance Support to Farmers
The net crop insurance support received by farmers from their crop insurance coverage is equal to the indemnity payments they receive less the premium cost they pay for coverage. Because federal crop insurance is subsidized and the Risk Management Agency (RMA) is mandated to set insurance rates to be close to actuarially fair, the net insurance support farmers receive should be positive, on average, through time.
Net crop insurance support to farmers has two components: indemnity payments less the total (unsubsidized) premiums collected – net indemnities – and the subsidized portion of total premium – a subsidy transfer. Thus, net crop insurance support is a function of the losses realized by the farm, the policy and coverage selections made by the farmer, the premium rates set by RMA, and the subsidy rates applied to total premiums.
If total premiums are set to match the indemnities paid to cover losses, the loss ratio equals one and the net indemnities should be zero. Given that RMA is required to rate insurance to be fair but also maintain a loss reserve, a target loss ratio of 0.88 is often used as a target. Consequently, net indemnities should be slightly negative on average over time.
Subsidizing the total premium increases the farmer net crop insurance support. If the portion of the premium that is subsidized is greater than the loss reserve built into the target loss ratio, the net crop insurance support received by producers should be positive.
Historical Insurance Performance
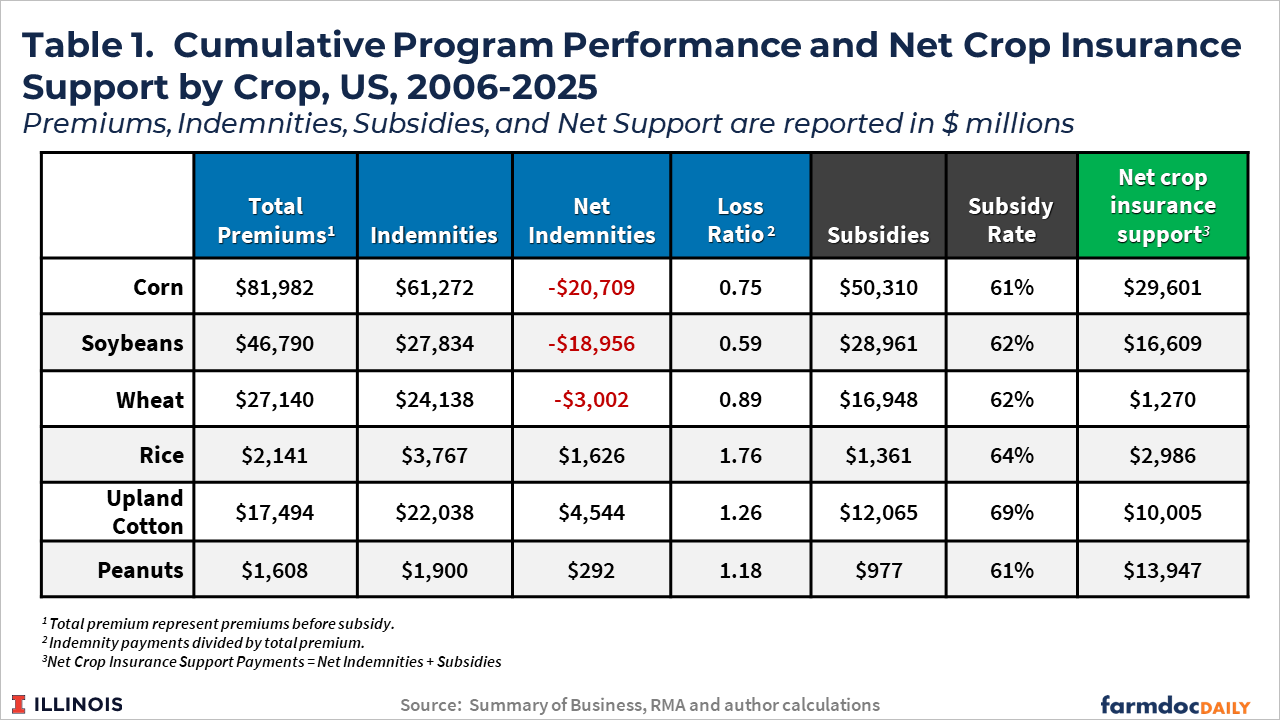
Crop insurance performance by crop is assessed using RMA data from 2006 to 2025. Table 1 shows total premiums paid (this includes the farmer-paid portion and the premium assistance from the federal government), total indemnities paid out to insured farmers, net indemnities, the cumulative loss ratio, subsidies received and the average subsidy rate by crop for the major row crops in the federal program.
Over the last 20 years, average insurance performance has varied significantly across these crops. Corn and soybeans have had average loss ratios below the 0.88 target. The average performance for wheat has been close to the target with an average loss ratio of 0.89. For rice, cotton and peanuts the average loss ratio over the past 20 years has been well above target.
The negative net indemnities for corn, soybean, and wheat acres offset some of the subsidized portion of total premium collected. In contrast, the positive net indemnities flowing to rice, cotton and peanuts have added to the subsidized portion of total premium, enhancing the net crop insurance support received by the producers of those crops as a group.
The average subsidy rates reflect producers’ choices of policies and coverage levels and, in general, have been similar across crops, except for cotton which has higher subsidy rates associated with average coverage level choice and the use of products with higher subsidy rates (i.e. STAX). Even with the negative net indemnities for some crops, the subsidy portion has been high enough to result in positive net crop insurance support for all crops.
What If Target Loss Ratios Were Achieved by Crop and County?
To illustrate how much the variation in realized premium rating performance has impacted net payments to insured farmers, a simple historical “what-if” analysis is conducted assuming that the 0.88 target loss ratio was met for every crop and county. To do this, historical premiums are adjusted by crop and county to match the 0.88 loss ratio target. For county-crop scenarios where the historic loss ratio exceeds the 0.88 target, premiums are increased. For county-crop scenarios where the historic loss ratio is below the target, premiums are reduced.
Premium adjustments change net indemnities and premium subsidies. For county-crop situations where the adjustment is to increase premiums, net indemnities will decline by the amount of the premium increase. At the same time, premium subsidies will increase by the average subsidy rate times the premium adjustment. This will result in a net reduction in the net support received by farmers (indemnities less adjusted farmer-paid premium) that is smaller in size than the increase in total premium. Similarly, situations where the premium adjustment is negative will see an increase in net indemnities combined with a smaller reduction in subsidy, resulting in an overall increase in the net support received by farmers.
This simple approach holds historical insurance choices, and thus historical loss experience, constant. In reality, premium adjustments could also change producer choices, shifting adoption across products and coverage levels which would lead to additional changes in loss experience, net indemnities, subsidies, and net support received by farmers.
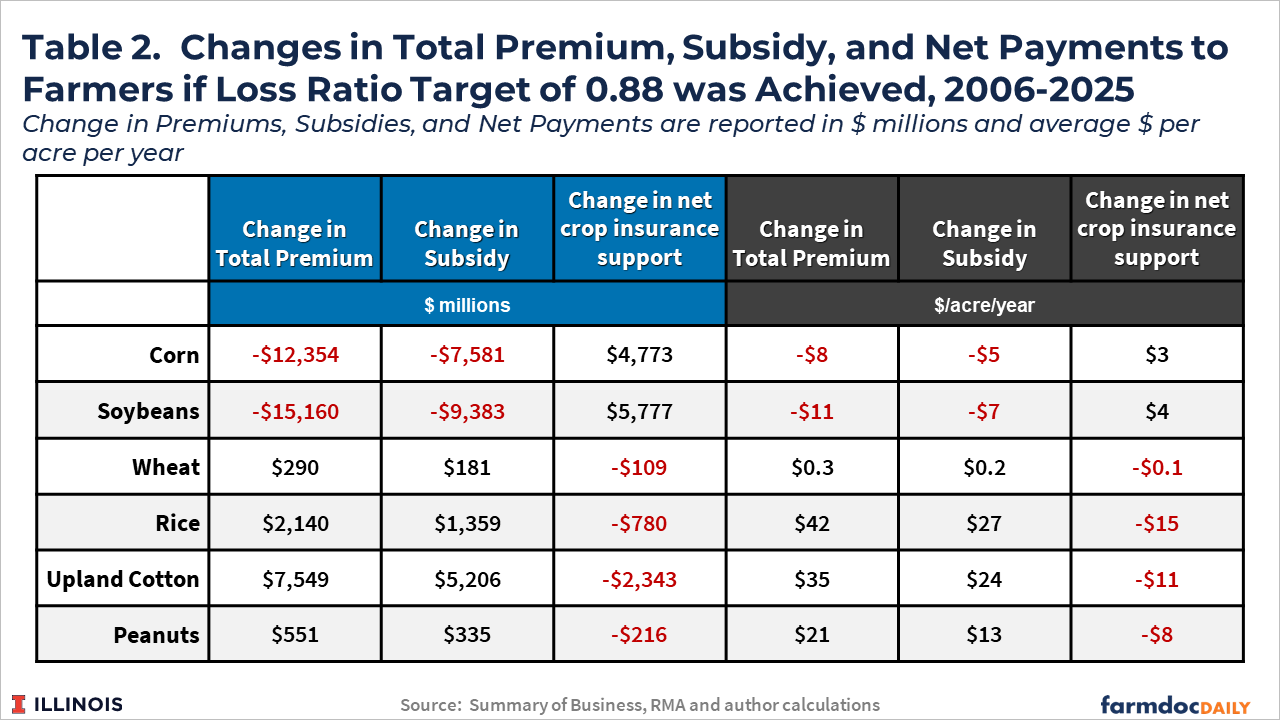
Table 2 summarizes the premium adjustment and resulting impacts on subsidy and net support to farmers at the crop level. Premiums charged on insured corn acres over the past 20 years would have had to be $12.4 billion lower to increase the loss ratio to 0.88. This reduction in total premium would have implied a nearly $7.6 billion reduction in premium subsidies on insurance for corn acres, or a net increase in crop insurance support received by farmers with insured corn acres of nearly $4.7 billion. Insured soybean acres would have needed a premium reduction of $15.2 billion, reducing premium subsidies on insured soybean acres by $9.4 billion and an increase in total support to farmers with insured soybean acres of nearly $5.8 billion. Total premiums on wheat acres would have needed to be $290 million higher, increasing subsidy outlays by $181 million and reducing $109 million in net support to farmers on insured wheat acres.
Premium increases of $2.1, $7.5, and $0.5 billion would have been needed to reduce the historical loss ratios for rice, cotton, and peanuts, respectively, over the past 20 years. These higher premiums would have been partially offset by higher subsidy outlays so that the net support to insured acres would have declined by $0.8, $2.3, and $0.2 billion for rice, cotton, and peanuts.
These estimates are aggregate values across all insured acres for these crops over the 20 year period. Dividing by total acres insured over that period provides estimates on a $ per acre per year basis that are also provided in Table 2. Insured corn and soybean acres would have needed to pay $8 and $11 per acre less in premiums per acre per year to achieve the target loss ratio. By paying less premiums, the subsidy transfer would have been reduced by $5 and $7, respectively. Thus, the net impact of adjusting actuarial performance would be an increase in benefit of $3 per acre for corn and $4 per acre for soybean. The change in net insurance support for wheat would be less than $1 per acre.
Rice, cotton and peanut acres would have seen an average increase in premiums of $42, $35 and $21 per acre, respectively. These higher premiums would have resulted in increases in subsidized premium assistance of $27, $24 and $13 per acre. Net insurance support to farmers would be reduced by $15, $11 and $8 per acre relative to historical experience.
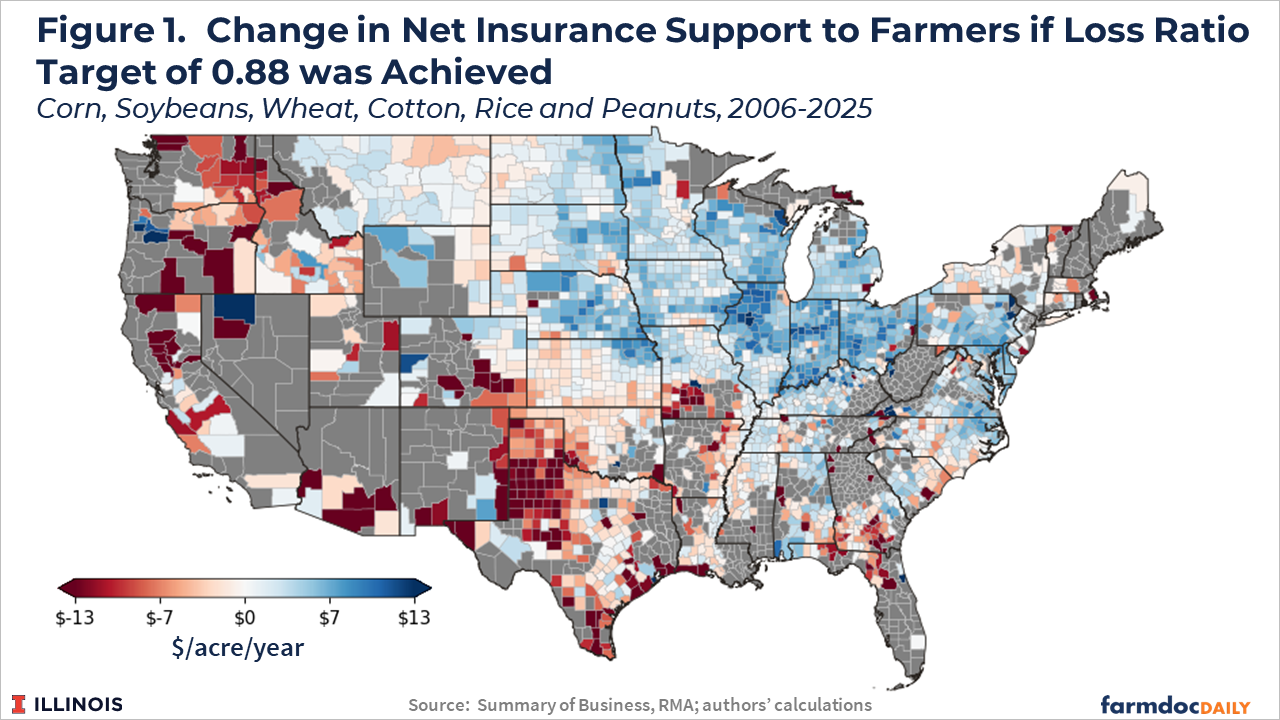
The per acre per year values in Table 2 would vary significantly at the county level, with regional patterns reflecting crop mixes and regional variation in historical performance relative to the aggregate performance measures at the crop level illustrated in Table 1. Figure 1 provides an illustration of this regional variation, showing the estimated change in net insurance support per acre per year by county. Counties with average historical loss ratios below the 0.88 target for the mix of crops insured in that county are shown in shade of blue in Figure 1. In other words, insured farmers in these counties should have paid less in premiums over the past twenty years based on their loss experiences. Counties in shades of red indicate areas where the loss ratio exceeded the target and premiums would have needed to be higher to meet the target loss ratio, resulting in reductions in net insurance support.
Areas where premiums would have need to be lowered are concentrated in the Midwest, with required premium adjustments resulting in net increases in insurance support up to $16 per acre per year. This reflects the fact that corn and soybeans are the predominate crops in this region. Areas where premiums would have needed to be higher occur in regions where the higher loss ratio crops (cotton, peanuts and rice) account for larger acreage shares.
Discussion
While the actuarial performance target for the federal crop insurance system has largely been achieved, in aggregate, over the past twenty years, performance has differed across crops and regions in the U.S. (see farmdoc daily, July 21, 2026). This had led to variation in the net insurance support received by producers at the crop- and regional-levels.
Legislation mandates that the federal crop insurance system should be actuarially sound, which implies fair rates plus a reserve (see farmdoc daily, April 11, 2024). It does not, however, clearly specify the level at which the mandate needs to be achieved. If target loss ratios were intended to be met at a county and crop level, the historical performance of the program would not be viewed as successfully achieving the targets.
A simple historical analysis shows that premiums would have had to been lower for certain crops and regions (corn and soybeans, mainly in the Midwest) and higher for others (rice, cotton, and peanuts, mainly the South/Southeast). This implies an increase in net support that would flow to low loss experience crops and regions, and a reduction in net support to high loss experience crops and regions. These gains and losses in net indemnities associated with premium adjustments would be partially mitigated by changes in subsidy outlays in terms of the net impact on insurance support flowing to farmers. The reduction in premiums in low loss areas would be partially offset by lower subsidies on a per acre basis and vice versa.
The task of maintaining an actuarially sound program is very complex. Even if loss ratios were specifically mandated to be actuarially sound at the county and crop level, we could continue to experience differences in actual performance and net insurance support flows across crops and regions. Moreover, performance targets and net benefits per acre are not expected to be achieved in individual years; losses will naturally vary across crops and regions based on that year’s growing and economic conditions. However, one should expect over a long period of time that premiums charged should match losses plus a reasonable reserve. When coupled with premium subsidies, this should result in positive net insurance support flowing to all producers who carry federal crop insurance coverage.
This illustrates the importance of crop insurance performance for farmer benefits, which will become an even more central topic going forward, given the increase in subsidies that will boost adoption – especially of supplemental area plans (i.e. the Supplemental and Enhanced Coverage Options (SCO and ECO)).
References
Schnitkey, G., H. Monaco, C. Zulauf and N. Paulson. "Crop Insurance Loss Experience in 2025: More of the Same." farmdoc daily (16):128, Department of Agricultural and Consumer Economics, University of Illinois at Urbana-Champaign, July 21, 2026.
Coppess, J., G. Schnitkey, B. Sherrick, N. Paulson and I. Flores. "The Dilemma of Actuarial Soundness, A Legislative History." farmdoc daily (14):70, Department of Agricultural and Consumer Economics, University of Illinois at Urbana-Champaign, April 11, 2024.
Disclaimer: We request all readers, electronic media and others follow our citation guidelines when re-posting articles from farmdoc daily. Guidelines are available here. The farmdoc daily website falls under University of Illinois copyright and intellectual property rights. For a detailed statement, please see the University of Illinois Copyright Information and Policies here.