








Insured Acres, Base Acres, and the Farm Bill’s Crop Risk Assistance
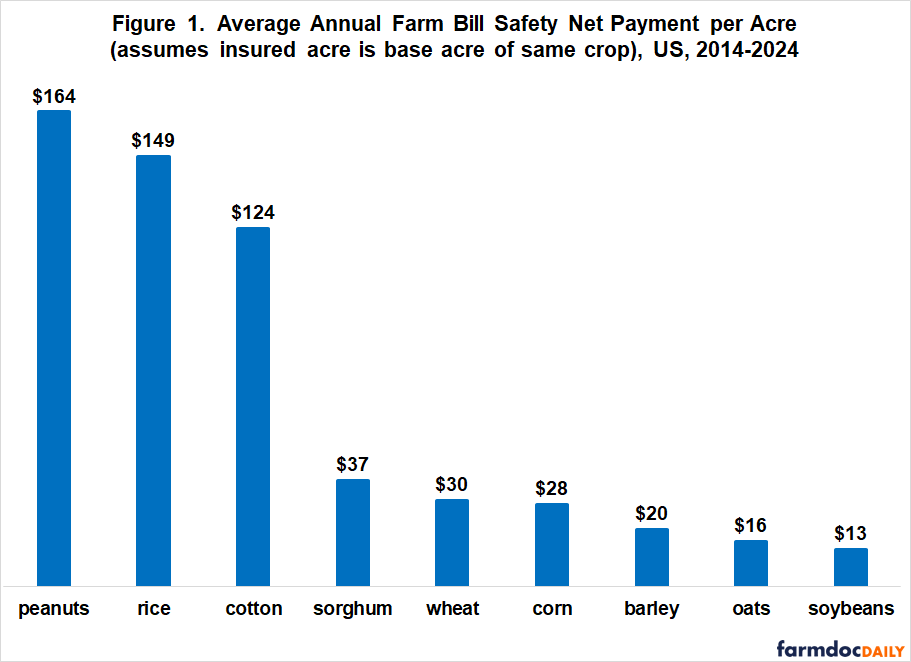
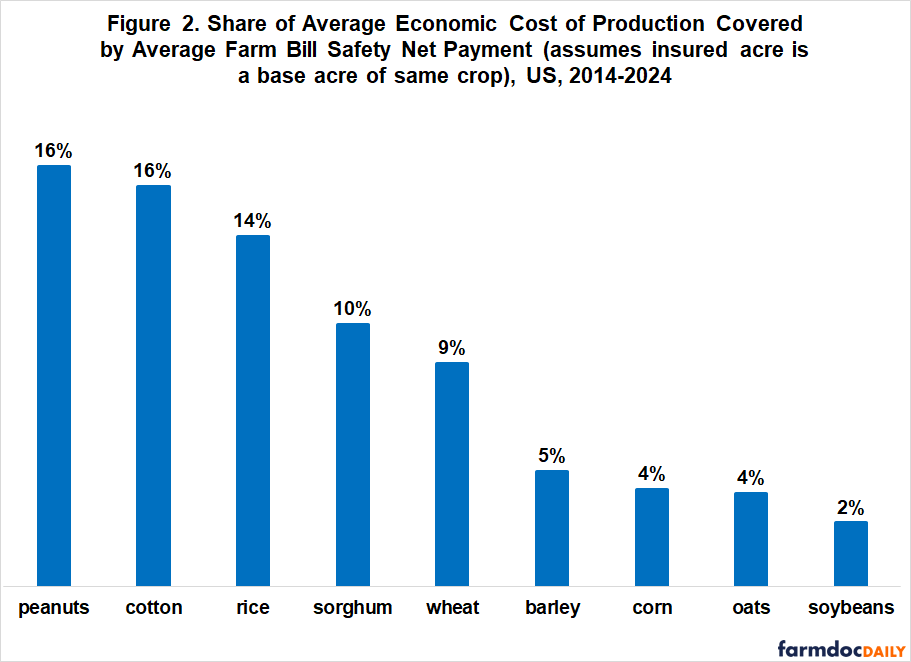
The US farm bill crop safety net targets two risks. Crop insurance targets production-period low yield and revenue risk. Commodity programs target multiple-year low price and revenue risk. A farm takes full advantage of this safety net when a planted acre is insured and is a base acre of the same crop. Only when this match occurs can per acre crop insurance and commodity program payments be added. Over the 2014-2024 crop years, crop insurance plus commodity program payments averaged $145 per acre per year for peanuts-rice-cotton and $24 per acre per year for sorghum-wheat-corn-barley-oats-soybeans (see Figure 1), covering, respectively, roughly 15%, 10%, 5%, and 2% of average annual cost to produce cotton-peanuts-rice, sorghum-wheat, barley-corn-oats, and soybeans (see Figure 2). These figures highlight the importance of being able to match an insured acre with a base acre.
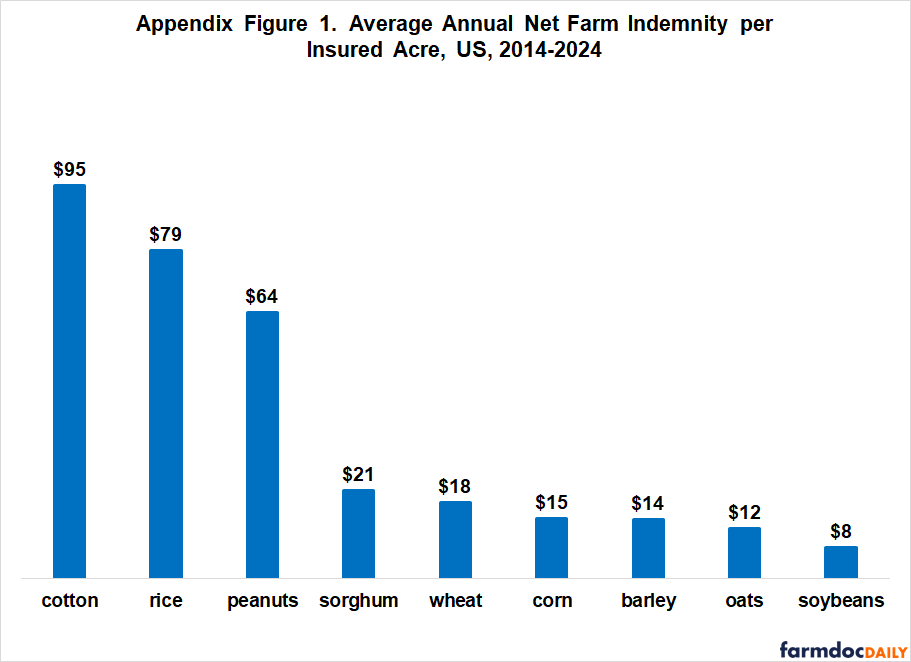
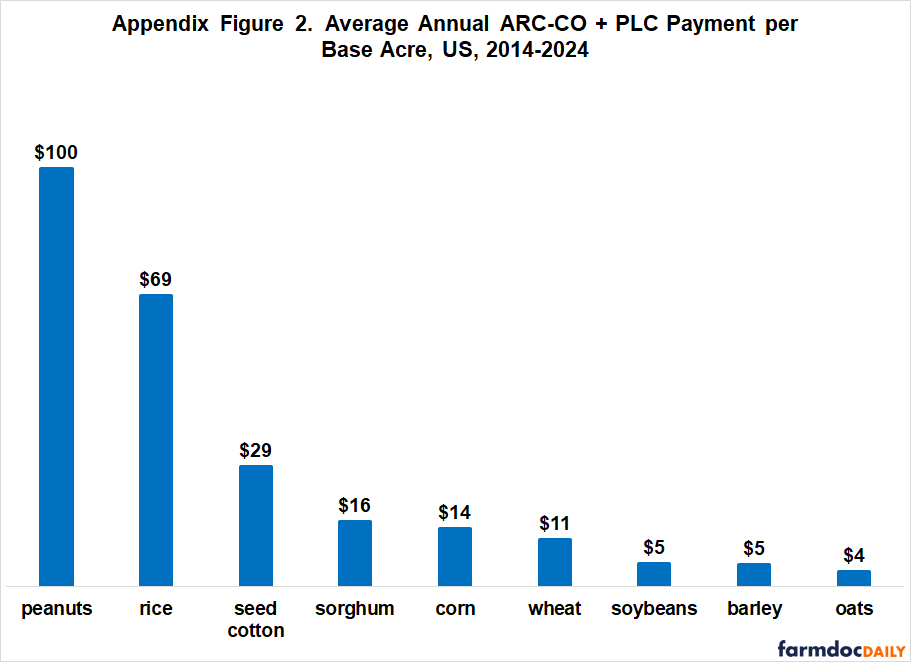
Figures 1 and 2 use (1) base acres from USDA, FSA (US Department of Agriculture, Farm Service Agency), (2) insured acres from USDA, RMA (Risk Management Agency), (3) ARC-CO (Agriculture Risk Coverage – County) and PLC (Price Loss Coverage) payments from USDA, FSA and University of Illinois at Urbana-Champaign (farmdoc daily, November 11, 2025 and May 14, 2026), (4) insurance indemnities net of farm paid premiums from USDA, FSA, and (5) cost of production from USDA, ERS (Economic Research Service). Average annual crop-by-crop net indemnities per insured acre and ARC-CO plus PLC payments per base acre are, respectively, in Appendix Figures 1 and 2.
Insured vs. Base Acres
The question of how often an insured acre is a base acre can only be answered with individual farm data. Such data are not publicly available. Note, this is a farm operation, not FSA farm question. A farm operation can involve many FSA farms. Its base acres are the sum of its FSA farms’ base acres.
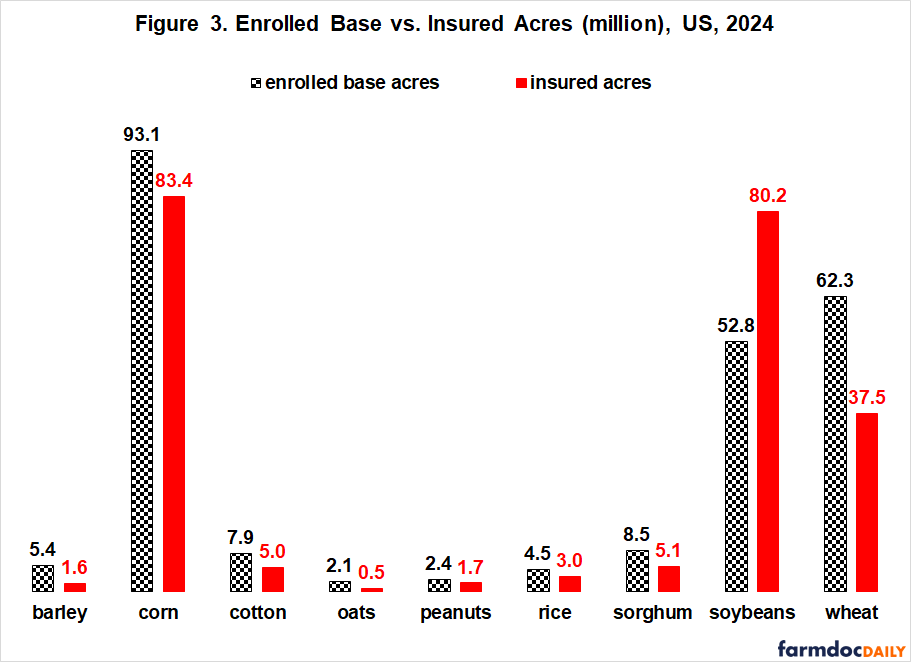
US data can provide only a rough insight. For the 2024 crop year, insured acres were less than ARC-CO plus PLC enrolled base acres for all crops in Figure 3 except soybeans. Thus, at the US level, an insured acre could be matched with a base acre. Of course, this is an overstatement as differences can be substantial on individual farms. However, base acres were acres planted to the crop at some time in the past and planted acres change relatively slowly from year to year. Thus, crops planted on a farm today were likely planted on the farm in previous years. This is particularly true for crops such as wheat, oats, barley, and cotton with declining acres. Their planted acres will tend to concentrate in areas with the highest competitive advantage. While US data provides only a crude approximation, these two considerations imply a nontrivial likelihood that today’s insured planted acres can be matched with base acres of the same crop for a notable number of US acres. For these acres, per acre crop insurance net indemnities and commodity program payments can be added together. Last, for farmers, soybeans’ notably smaller base than insured acres is muted by US soybeans having a profit at harvest in 18 of 30 years since the 1996 Farm Bill authorized “freedom to farm” (USDA, ERS).
The 2025 Farm Bill’s new base acre provision adds up to 30 million new base acres for current program crops (farmdoc daily, March 2, 2026). Some of these new base acres will come from crops that are currently not program crops. New base acres for current program crops increase the likelihood that a current program crop’s insured acres on a farm can be matched with base acres on the farm.
Discussion
Being able to match insured acres with base acres of the same crop allows the farm’s planted acre risk to match up with the farm bill’s crop safety net risk assistance from crop insurance and commodity programs, thus allowing addition of crop insurance and commodity program payments for that acre.
The 2025 Farm Bill’s new base acre provision to add 30 million new base acres for current program crops has nontrivial farm management benefits by increasing the likelihood that an insured acre of a program commodity on the farm can be a base acre for the same program commodity on the farm.
References
Monaco, H., G. Schnitkey, N. Paulson, J. Coppess and C. Zulauf. "2025 ARC/PLC Final Estimates." farmdoc daily (16):85, Department of Agricultural and Consumer Economics, University of Illinois at Urbana-Champaign, May 14, 2026.
Paulson, N., G. Schnitkey, J. Coppess, C. Zulauf and H. Monaco. "Estimates of 2024 ARC-CO and PLC Payments." farmdoc daily (15):208, Department of Agricultural and Consumer Economics, University of Illinois at Urbana-Champaign, November 11, 2025.
US Department of Agriculture, Economic Research Service. July 2026. Cost of Production. https://www.ers.usda.gov/data-products/commodity-costs-and-returns/
US Department of Agriculture, Farm Service Agency. July 2026. ARC-PLC Program Data https://www.fsa.usda.gov/resources/programs/arc-plc/program-data
US Department of Agriculture, Risk Management Agency. July 2026. Summary of Business. http://www.rma.usda.gov
Zulauf, C., N. Paulson, J. Coppess and G. Schnitkey. "New Commodity Program Base Acres." farmdoc daily (16):34, Department of Agricultural and Consumer Economics, University of Illinois at Urbana-Champaign, March 2, 2026.
Appendices
Disclaimer: We request all readers, electronic media and others follow our citation guidelines when re-posting articles from farmdoc daily. Guidelines are available here. The farmdoc daily website falls under University of Illinois copyright and intellectual property rights. For a detailed statement, please see the University of Illinois Copyright Information and Policies here.