








Farm Machinery Demand Remains Weak as Manufacturers Manage Production
The U.S. farm machinery and equipment market remains in a prolonged downturn. Through July 2026, sales of tractors and combines were below year-earlier levels, with the steepest declines in four-wheel-drive and 100-plus-horsepower tractors. Manufacturers have continued to restrain production and reduce inventories, but machinery prices remain high. On Illinois grain farms, capital purchases have also fallen sharply from their 2023 peak.
In today’s farmdoc daily article, we build on our previous analysis (see farmdoc daily, February 27, 2026) and examine farm equipment sales, manufacturing production and inventories, machinery prices, and capital purchases by Illinois grain farms. Together, these indicators point to a market that is still contracting at the retail level even as the supply-side adjustment progresses.
Farm Machinery and Equipment Sales
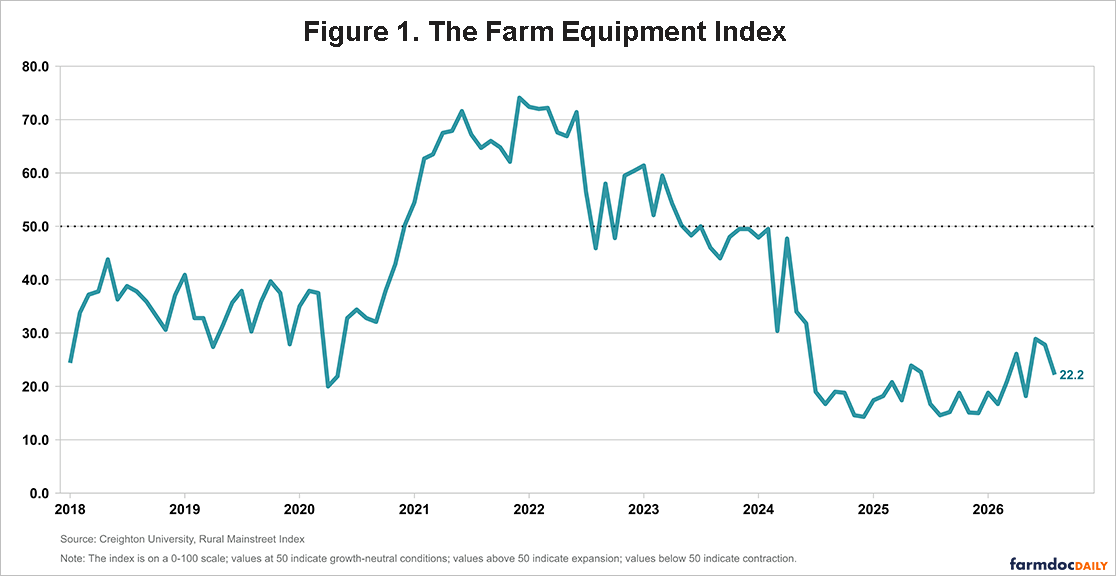
The Creighton University Rural Mainstreet Index provides a timely measure of farm equipment market conditions. It is based on a monthly survey of bank CEOs in a ten-state region and ranges from 0 to 100, with 50 representing growth-neutral conditions; values above 50 indicate expansion, while values below 50 indicate contraction.[1]
As shown in Figure 1, the farm equipment sales index fell to 22.2 in August 2026 from 27.8 in July. August marked the 36th consecutive month below growth-neutral conditions. The same survey found that borrowing for farm equipment purchases accounted for only 5.3% of agricultural lending, compared with 52.6% for real estate loans. Both results are consistent with continued caution among producers and lenders toward major equipment purchases.
National retail sales data from the Association of Equipment Manufacturers (AEM) tells the same story. U.S. tractor sales totaled 15,985 units in July 2026, down 10.9% from July 2025, while year-to-date sales were down 13.1%. The contraction was most pronounced among four-wheel-drive tractors, with sales falling 38.7% in July and 27.0% year to date. Year-to-date sales of two-wheel-drive tractors with at least 100 horsepower were down 15.5% compared with the same period in 2025. Self-propelled combine sales declined 5.3% in July and 10.2% year to date compared with their respective corresponding periods in 2025.
Manufacturing Production
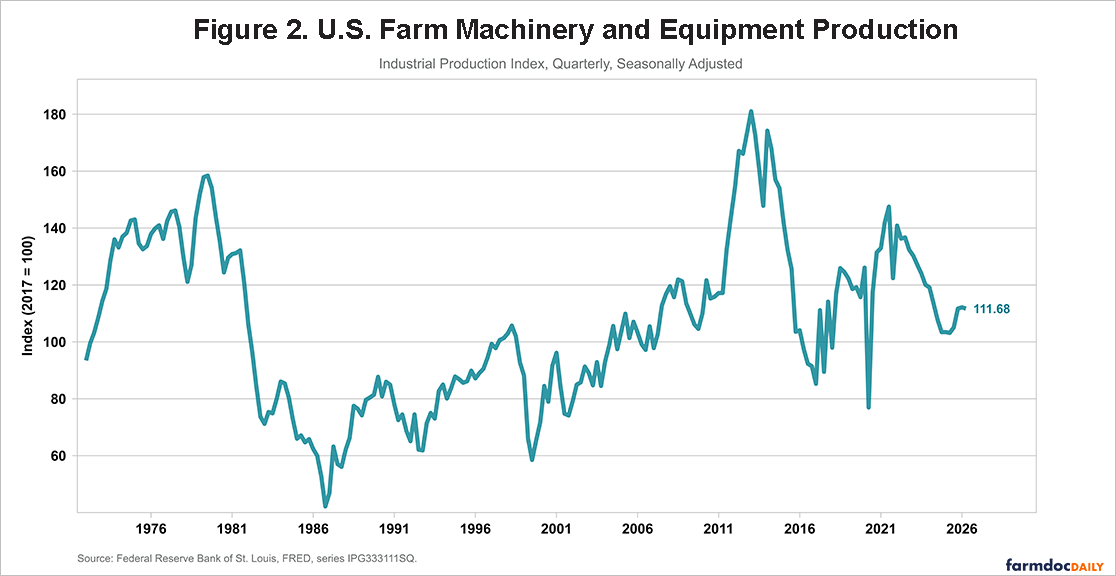
Production data are somewhat firmer than retail sales, as there has been a slight recovery in output. Figure 2 shows the Federal Reserve industrial-production index for farm machinery and equipment (see FRED: IPG333111SQ). The index came in at 111.68 in the second quarter of 2026, 8.27% above its second-quarter 2025 level of 103.15, but far below the levels we saw in 2021 and 2022.
Manufacturers serving the U.S. market remain cautious about production as they work to bring dealer inventories into balance with demand. AGCO reported that global production hours increased approximately 6% in the first half of 2026, largely reflecting a first-quarter rebound from low production levels in Europe. However, second-quarter hours were slightly lower than a year earlier, and the company expected full-year hours to decline slightly. Furthermore, AGCO indicated that further inventory adjustment in North America was needed before production could more closely match retail demand. CNH Industrial likewise planned to maintain low agricultural equipment production levels while working with dealers to reduce inventories. Deere & Co. also emphasized balancing production with demand, reporting that these adjustments had helped keep North American new-equipment inventories tight while improving used-equipment inventories.
Manufacturer Inventories
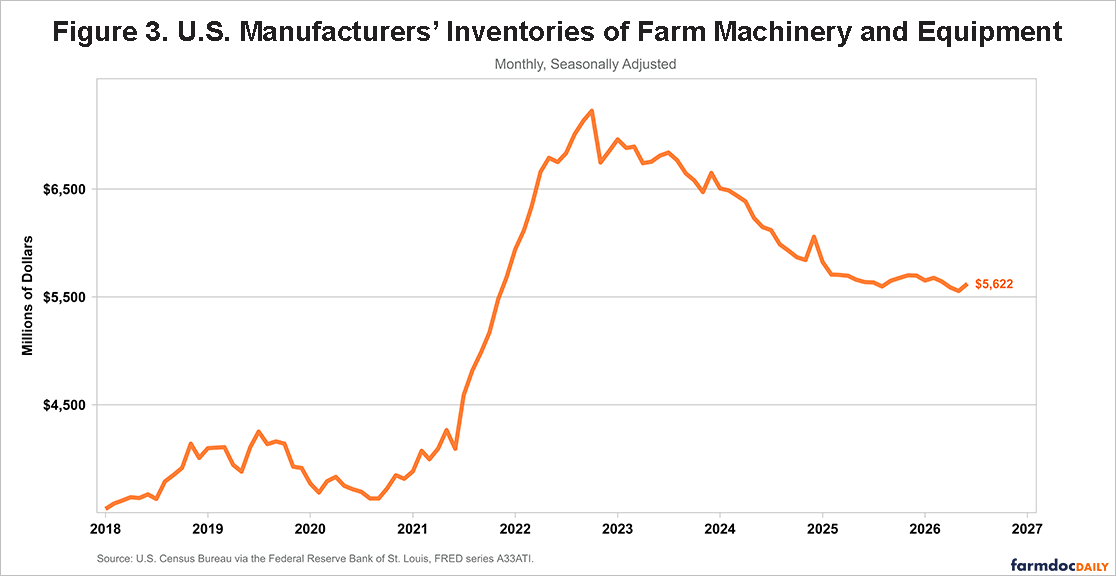
Alongside these production adjustments, inventories held by U.S. farm machinery and equipment manufacturers have declined substantially from their 2022 peak. As shown in Figure 3, U.S. farm machinery and equipment manufacturing inventories totaled $5.62 billion in June 2026 on a seasonally adjusted basis, approximately $1.60 billion, or 22.2%, below their October 2022 peak of $7.23 billion (see FRED: A33ATI). However, Figure 3 shows that the inventory drawdown has slowed, with inventories remaining near $5.6 billion in recent months.
Machinery Prices Remain Elevated
Weak equipment sales have not translated into lower machinery prices as inventory levels remain tight. According to data from the USDA National Agricultural Statistics Service, the prices-paid index for machinery was 173.9 in June 2026, up 2.1% from 170.3 in June 2025. The tractor index rose 1.9%, from 142.9 to 145.6, while the self-propelled machinery index rose 1.5%, from 171.0 to 173.5 (see Figure 4).
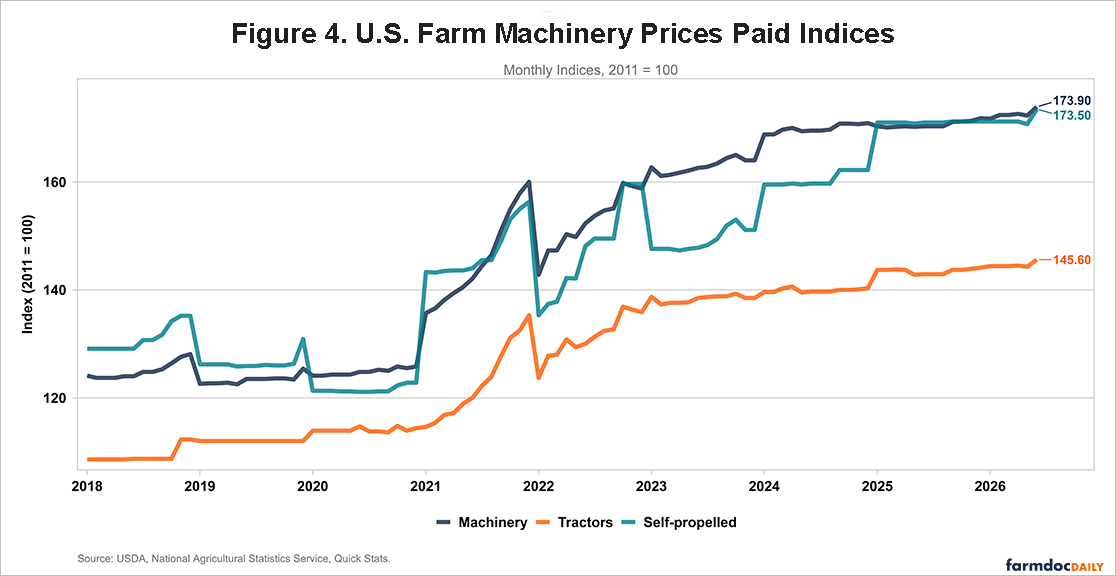
The rate of price increase has slowed considerably from 2021 and 2022, but the price level has not reversed. Relative to the 2011 base of 100, the June 2026 indexes indicate cumulative increases of 73.9% for machinery overall, 45.6% for tractors, and 73.5% for self-propelled machinery. Supply-chain disruptions, higher steel and other input costs, and strong farm incomes contributed to the earlier run-up. Weaker demand has since slowed price growth, but replacing equipment remains expensive for agricultural producers.
Capital Purchases on Illinois Grain Farms
Lastly, a recent farmdoc daily article (August 18, 2026) shows how weaker farm income is affecting capital investment on Illinois grain farms. Average capital purchases among farms enrolled in the Illinois Farm Business Farm Management (FBFM) program declined from $335,000 per farm in 2023 to $236,000 in 2024 and $184,000 in 2025. The two-year decline was $151,000 per farm, or 45.07%.
The decline in capital purchases followed a sharp drop in average accrual net farm income, from $446,000 in 2021 and $505,000 in 2022 to $13,000 in 2024 and $93,000 in 2025. Moreover, average net farm income is forecast to remain below $100,000 in 2026. Because capital purchases often respond to changes in farm income with a lag, purchases are also expected to be below $100,000 in 2026.
Summary
The U.S. farm machinery and equipment market continues to face weak demand despite some improvement in manufacturing production. Inventories have declined substantially from their 2022 peak, but the pace of reduction has slowed, and manufacturers remain cautious about increasing output. Meanwhile, machinery prices remain elevated, leaving producers with high replacement costs at a time when farm incomes provide less support for capital investment.
The decline in capital purchases on Illinois grain farms illustrates this pressure. Together, these indicators suggest that progress in adjusting production and inventories has not yet translated into a sustained recovery in equipment purchases. A stronger recovery will likely depend on improved farm profitability and greater confidence in committing funds to equipment replacement.
Notes
[1] The ten states are Colorado, Illinois, Iowa, Kansas, Minnesota, Missouri, Nebraska, North Dakota, South Dakota, and Wyoming.
References
AGCO. "AGCO Reports Second-Quarter Results." July 30, 2026.
Association of Equipment Manufacturers. “AEM United States Ag Tractor and Combine Report July 2026.” August 11, 2026.
Board of Governors of the Federal Reserve System. "Industrial Production: Manufacturing: Durable Goods: Farm Machinery and Equipment (NAICS = 333111) [IPG333111SQ]," retrieved from FRED, Federal Reserve Bank of St. Louis; https://fred.stlouisfed.org/series/IPG333111SQ, August 27, 2026.
CNH Industrial N.V. "CNH Industrial N.V. Reports Second Quarter 2026 Results." August 3, 2026.
Creighton University. "Rural Mainstreet Index Rises Above Growth Neutral." August 20, 2026.
Mashange, G. "The U.S. Farm Machinery & Equipment Market: Sales, Inventories, and Tariff Headwinds." farmdoc daily (16):33, Department of Agricultural and Consumer Economics, University of Illinois at Urbana-Champaign, February 27, 2026.
Schnitkey, G., B. Zwilling, N. Paulson and C. Zulauf. "Capital Purchases and Machinery Depreciation on Illinois Grain Farms." farmdoc daily (16):148, Department of Agricultural and Consumer Economics, University of Illinois at Urbana-Champaign, August 18, 2026.
U.S. Census Bureau. "Manufacturers' Total Inventories: Farm Machinery and Equipment Manufacturing [A33ATI]," retrieved from FRED, Federal Reserve Bank of St. Louis; https://fred.stlouisfed.org/series/A33ATI, August 27, 2026.
U.S. Department of Agriculture, National Agricultural Statistics Service. "Agricultural Prices." July 31, 2026.
Disclaimer: We request all readers, electronic media and others follow our citation guidelines when re-posting articles from farmdoc daily. Guidelines are available here. The farmdoc daily website falls under University of Illinois copyright and intellectual property rights. For a detailed statement, please see the University of Illinois Copyright Information and Policies here.