








Capital Purchases and Machinery Depreciation on Illinois Grain Farms
Over the past ten years, average annual capital purchases on Illinois grain farms have exceeded average annual net farm income, with government payments included in income. Generally, income from other sources has been used to fund farm-level capital purchases, much of which has been allocated to machinery. Over time, machinery purchases then have resulted in growing machinery depreciation costs on a per-acre basis. We discuss strategies for managing machinery costs.
Capital Purchases
Figure 1 shows net farm income and capital purchases on grain farms enrolled in Illinois Farm Business Farm Management (FBFM) from 2002 to 2025. Over time, farms included in these summaries have grown. Average tillable acres farmed were 960 acres in 2002, compared to 1,390 in 2025, a 44% increase over the 23 years.
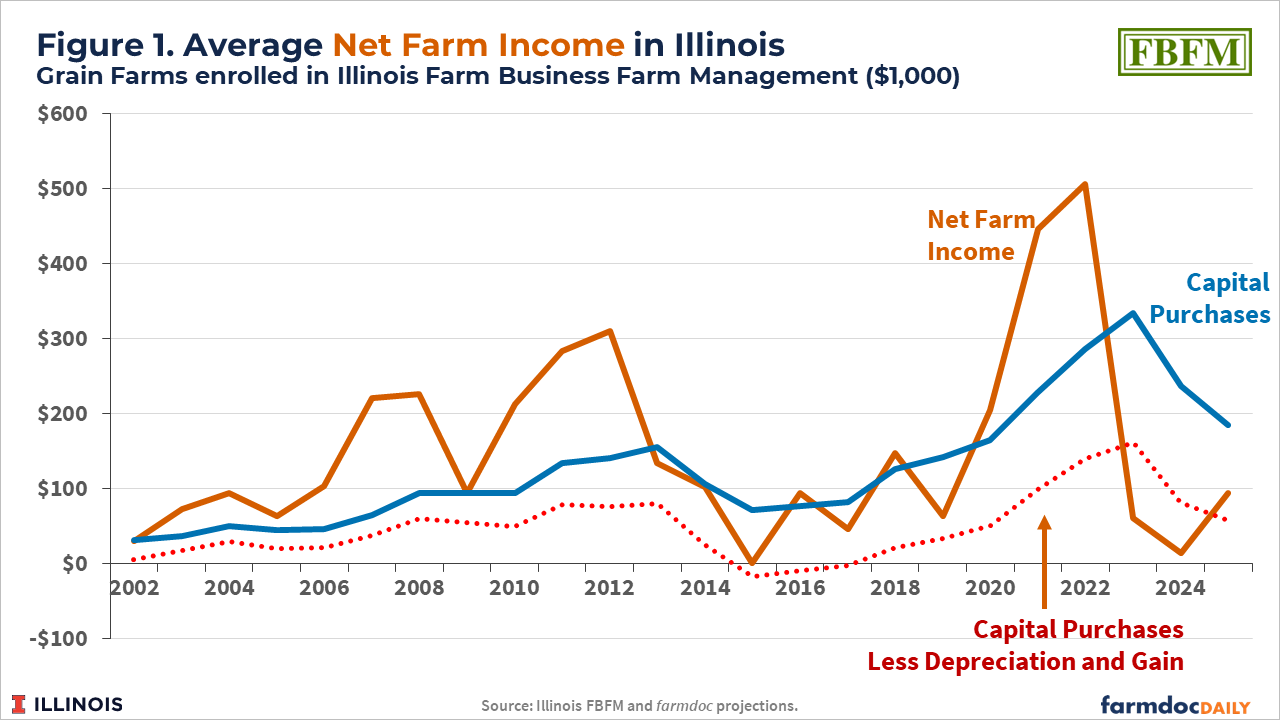
Average capital purchases on Illinois grain farms have declined from highs set in 2023, when capital purchases were $335,000 per farm. That high capital purchase value was associated with higher incomes in 2021 and 2022, when accrual net farm incomes averaged $446,000 and $505,000, respectively. Higher capital purchases are often associated with higher net farm income, with capital purchases declining when net farm incomes decrease, often in a lagged fashion. Since 2023, capital purchases have declined to $236,000 in 2024 and $184,000 in 2025, corresponding to lower net farm incomes of $13,000 in 2024 and $93,000 in 2025.
The outlook is for continued decline into 2026. Net farm incomes in 2026 are projected to be at roughly the same levels as in 2025, likely leading to another decline in capital purchases. Over time, capital purchases need to be less than net farm income for the farm to generate the funds necessary to cover them. Our expectations are for average incomes in 2026 to be less than $100,000, which means capital purchases will likely be below that amount.
Also shown in Figure 1 are capital purchases less depreciation on the income statement, and less the economic gain on sales of equipment. Depreciation is an economic charge associated with the purchases. FBFM used a 10-year life and a 125% declining balance depreciation method, which differs from depreciation used for tax purposes. If capital purchases exceed depreciation, the cost-basis value of machinery increases on the balance sheet. Over time, one would expect farmers to usually have positive capital purchases greater than depreciation for two reasons. First, machinery prices have increased over time. As a result, machinery values will increase as more expensive equipment is purchased to replace depreciated assets. Second, grain farms are increasing in size over time. As a result, machinery inventory needs to increase to handle larger areas.
Note that there were three years (2015, 2016, 2017) when capital purchases were less than depreciation. In those years, farmers were “living on depreciation” to supplement their low incomes.
So far, lower incomes between 2023 and 2025 have not resulted in capital purchases being less than depreciation plus sales gain. In fact, in 2023 and 2024, capital purchases less depreciation and sales gain exceeded net farm income. In those years, funds from non-farm sources were needed to cover capital purchases.
Overall, the financial position of grain farms enrolled in FBFM is stable. Debt-to-asset ratios on these farms remain at relatively low levels, with the average below 20% (see farmdoc daily, September 26, 2025). Debt levels on grain farms have increased, but the relative value of assets has increased as well, keeping debt-to-asset ratios constant. Therefore, on average, farms are not increasing debt relative to assets to maintain capital purchases.
Instead, farmers are using income from other sources to fund the difference between capital purchases and net farm income. Those sources include off-farm income by family members associated with the farming operation, as well as income from other businesses. Those businesses could include activities closely related to agriculture, such as seed sales and custom work. Many farms also operate other businesses that can generate cash.
Machinery Costs
Much of the capital purchases on grain farms is used to fund machinery purchases. Relatively high machinery purchases have increased the dollar value of machinery inventory on farms, leading to higher machinery depreciation, as illustrated in Figure 2.
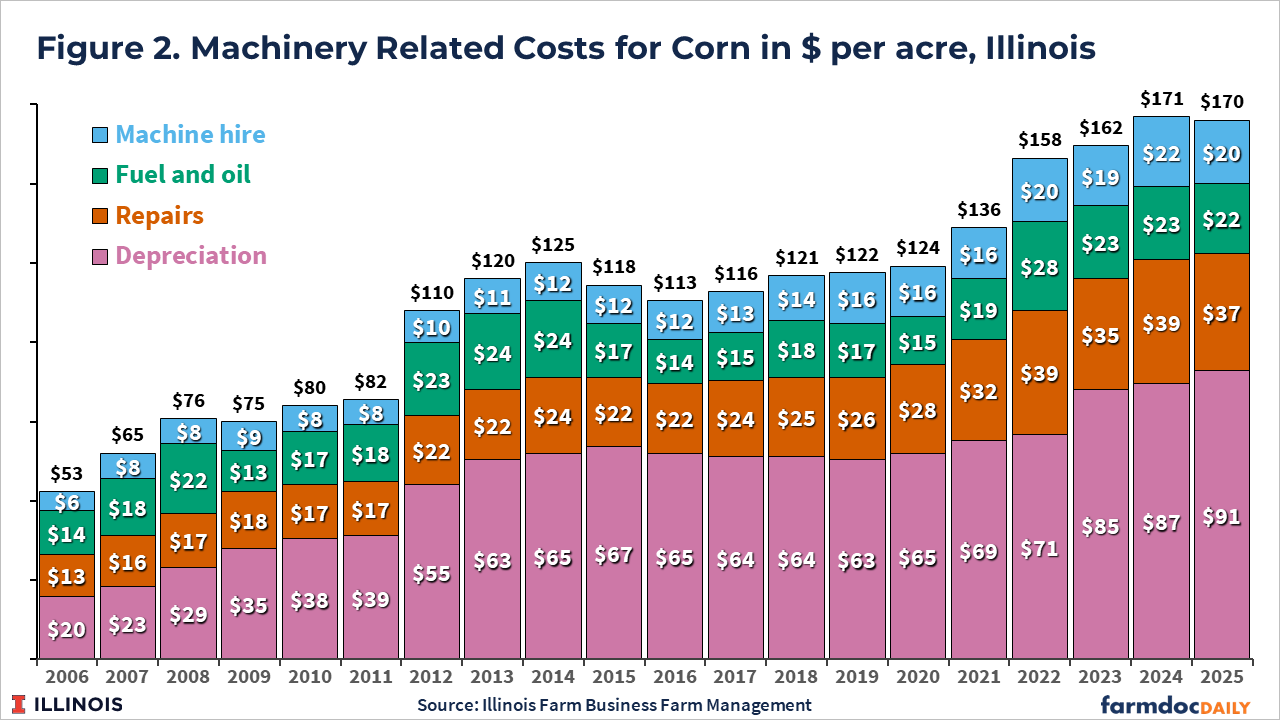
Figure 2 shows machinery-related costs on high-productivity Central Illinois grain farms. Those machinery-related costs include depreciation, repairs, fuel and oil, and machine hire.
In 2025, depreciation averaged $91 per acre, representing 53% of the $170 machinery-related costs for growing corn. Over time, machinery depreciation has increased from $20 per acre in 2006 to $91 per acre in 2025. The increase since 2020 has been substantial, coinciding with higher incomes and increased capital purchases. Machinery depreciation increased from $65 per acre in 2020 to $91 per acre in 2025, a $26-per-acre increase, or 40%.
While not as large, the other machinery-related costs have also increased.
- Repair costs average $37 per acre in 2025, up from $28 in 2020, a 32% increase.
- Fuel and oil costs averaged $22 per acre in 2025, up from $15 per acre in 2020, a 47% increase.
- Machine hire costs were $20 per acre in 2025, up from $15 per acre in 2020, a 33% increase.
Since depreciation is the largest category, lowering machinery-related costs often involves controlling future machinery purchases relative to acres operated. Approaches for reducing machinery-related costs are:
- Reduce the level of future machinery purchases. This approach delays capital purchases, causing depreciation to decline over time. This approach does have its limits in that repairs may increase, offsetting some of the declines in machinery depreciation.
- Farm more acres. If the machinery inventory can be maintained at its current level, farming more acres will reduce machinery depreciation per acre. However, this approach should be pursued with caution. There is limited evidence that larger farms necessarily have lower per-acre machinery costs. For example, a recent examination of Central Illinois grain farms found that farms with over 4000 acres had machinery costs that averaged $93 per acre, compared to a $68 per acre average for farms with 1,200 to 1,999 acres (see Table 2 of farmdoc daily, July 18, 2025). Increasing farm size does not necessarily reduce per-acre costs. Cost management decisions remain important for large farms. Moreover, increasing farm size can reduce depreciation costs per acre while still reducing farm profitability if land costs are high due to high cash rents or debt-servicing costs.
- Reduce machinery inventory. Reducing the machinery inventory will reduce depreciation. Some examples of possible reductions include: 1) Reducing the number of late-model tractors from 3 to 2, 2) Reducing the number of planters from 2 to 1, and 3) Reducing the number of tillage pieces on the farm from 3 to 2. All of the above reductions will reduce total machinery inventory, resulting in lower machinery depreciation. Of course, trade-offs exist. Reducing the number of planters from 2 to 1 could be associated with lower yields as planting is delayed. Having two planters could also mean one is designed specifically for soybeans and the other for corn, which also may result in higher yields.
- Re-evaluate combine ownership. The combine has increased greatly in cost over the past several years, with large increases occurring between 2021 and 2023 (see farmdoc daily, October 14, 2025). Those purchase prices have changed the economics of size associated with combines. Operating a relatively new combine over less than 2,500 acres increases costs dramatically. Seeking alternatives to lowering those costs could involve having two or more farming operations own one combine, or custom hiring some combining.
Discussion
Ways of managing machinery costs exist. Most revolve around maintaining the proper level of machinery inventories relative to acres farmed. Reducing machinery depreciation, in particular, requires careful thought to machinery investment decisions.
A more strategic decision may relate to the use of overall funds available to farming operations. Most farming operations remain strong, with much of that strength stemming from income generated outside the operation. Those sources include off-farm employment and other businesses. In recent years, Illinois grain farms have used those other sources of income to fund their farming operations. Investing time and financial resources in off-farm employment or other businesses provides diversification and can result in better financial outcomes for the family. However, while funding farm operations with other sources of income may be necessary in the short-term, the conditions under which this is an advisable longer-term strategy should be evaluated.
A significant portion of the net farm income generated in the past 8 years has been associated with government payments. Those payments have included ad hoc sources such as Market Facilitation Payments, pandemic-related programs, and the more recent Emergency Commodity Assistance and Farmer Bridge Assistance programs (ECAP and FBA). Those economic ad hoc assistance payments exist alongside disaster ad hoc payments, commodity title payments, and support from crop insurance. The continuation of those payments does not appear to be in jeopardy, but the possibility that they end or are lowered without corresponding improvements in return prospects should be considered.
References
Mashange, G. and B. Zwilling. "Solvency Series: Healthy Debt-to-Asset Ratios Amid Rising Debt Servicing Costs." farmdoc daily (15):177, Department of Agricultural and Consumer Economics, University of Illinois at Urbana-Champaign, September 26, 2025.
Schnitkey, G., N. Paulson, C. Zulauf and B. Zwilling. "Large Increase in Machinery Costs Suggests Need to Reconsider Machinery Purchase Decisions." farmdoc daily (15):189, Department of Agricultural and Consumer Economics, University of Illinois at Urbana-Champaign, October 14, 2025.
Zwilling, B. "How Farm Size Affects Crop and Equipment Costs in Illinois?" farmdoc daily (15):131, Department of Agricultural and Consumer Economics, University of Illinois at Urbana-Champaign, July 18, 2025.
Disclaimer: We request all readers, electronic media and others follow our citation guidelines when re-posting articles from farmdoc daily. Guidelines are available here. The farmdoc daily website falls under University of Illinois copyright and intellectual property rights. For a detailed statement, please see the University of Illinois Copyright Information and Policies here.