


The U.S. Farm Machinery & Equipment Market: Sales, Inventories, and Tariff Headwinds
The U.S. farm machinery and equipment market experienced challenges across many fronts in 2025. Recent data suggests many new and used equipment sales categories continued to decline last year. Additionally, lower grain prices and farm incomes, along with elevated borrowing costs, have dampened farmer demand for equipment and machinery, while major manufacturers, Deere & Co., CNH Industrial N.V., and AGCO, are adjusting their inventories by scaling back production. Perhaps most significant was the introduction of sweeping tariffs in 2025, which squeezed manufacturer margins. In today’s farmdoc daily article, we build upon our previous analysis (see farmdoc daily, October 24, 2025) and provide a quarterly update on the current state of the farm machinery and equipment market, and the potential for tariff relief following the recent U.S. Supreme Court ruling this month.
Farm Machinery and Equipment Sales
According to the Creighton University Farm Equipment Sales Index (see Mainstreet Economy), a monthly survey of bank CEOs across a ten-state region dependent on agriculture and/or energy, current conditions stand in sharp contrast to the prolonged expansion in sales observed just a few years ago.[1] As shown in Figure 1, the index is measured on a 0–100 scale, where 50 represents growth-neutral conditions. Values above 50 indicate expansion, while values below 50 signal contraction. From December 2020 through July 2022, the index remained above growth-neutral on a sustained basis, peaking at 74.1 in December 2021, reflecting strong demand in farm equipment during that period. Since October 2023, however, the index has remained below growth-neutral for 30 consecutive months. In February of this year, it fell to 16.7, down from 18.8 in the previous month.
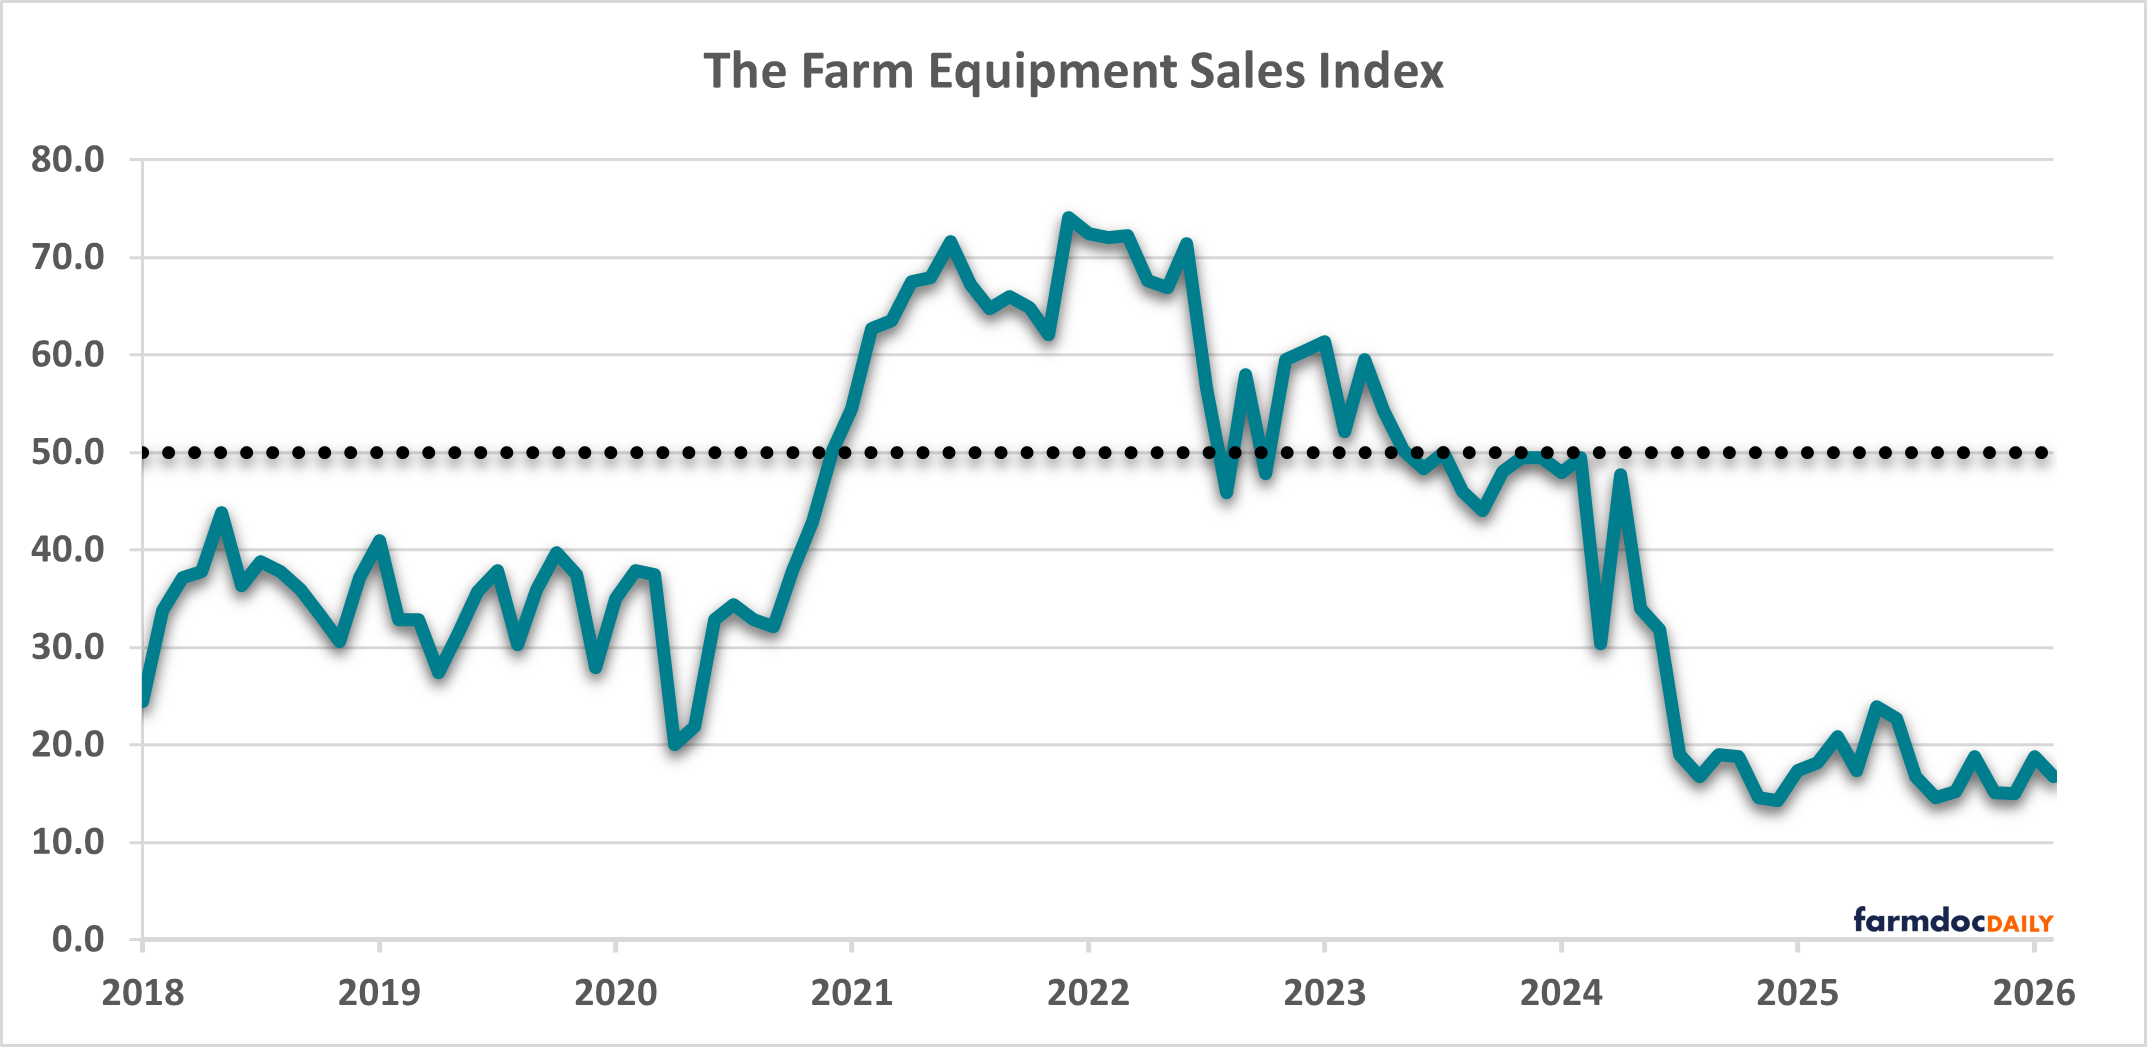
Note: The index is on a 0-100 scale; values at 50 indicate growth-neutral conditions; values above 50 indicate expansion; values below 50 indicate contraction.
Data from the Association of Equipment Manufacturers (see U.S. Ag Tractor and Combine Reports) provides a granular illustration of the decline in retail sales at a national level. In 2020, farm tractor sales increased by 17.74%, rising from 244,771 units in 2019 to 288,187 units. In the same period, combine sales grew by 4.94%, increasing from 4,793 to 5,030 units. This upward trend continued into 2021, with sales peaking at 317,944 tractors (up 10.33%) and 6,278 combines (up 24.81%). In 2022, the market began to diverge: combine sales extended their gains by 15.45% to 7,248 units, while tractor sales declined by 14.24% to 272,659 units. The overall market downturn became more pronounced thereafter. In 2023, tractor sales fell an additional 8.23% to 250,218 units, though combine sales managed a modest 1.39% rise to 7,349 units. By 2024, both categories were firmly in decline. Tractor sales dropped by 13.16% to 217,279 units, and combine sales plunged by 24.40% to 5,556 units. Preliminary data for 2025 indicates continued deterioration in the market, with annual U.S. farm tractor sales decreasing another 9.86% to 195,857 units and combine sales plummeting 35.58% to 3,579 units.
According to the 2026 Dealer Business Outlook & Trends Report by Ag Equipment Intelligence, 67.5% of surveyed dealers reported declines of 2 or more percent in new equipment sales in 2025 compared to the previous year, while 46.3% reported similar declines in used equipment sales (see 2026 Dealer Business Outlook & Trends Report Highlights). Additionally, 44.3% of dealers are forecasting a decline of 2 percent or more in new equipment sales in 2026, which is smaller than the forecasts for 2025, while 32.9% of dealers are forecasting similar declines for used equipment sales.
Manufacturer Inventories & Prices
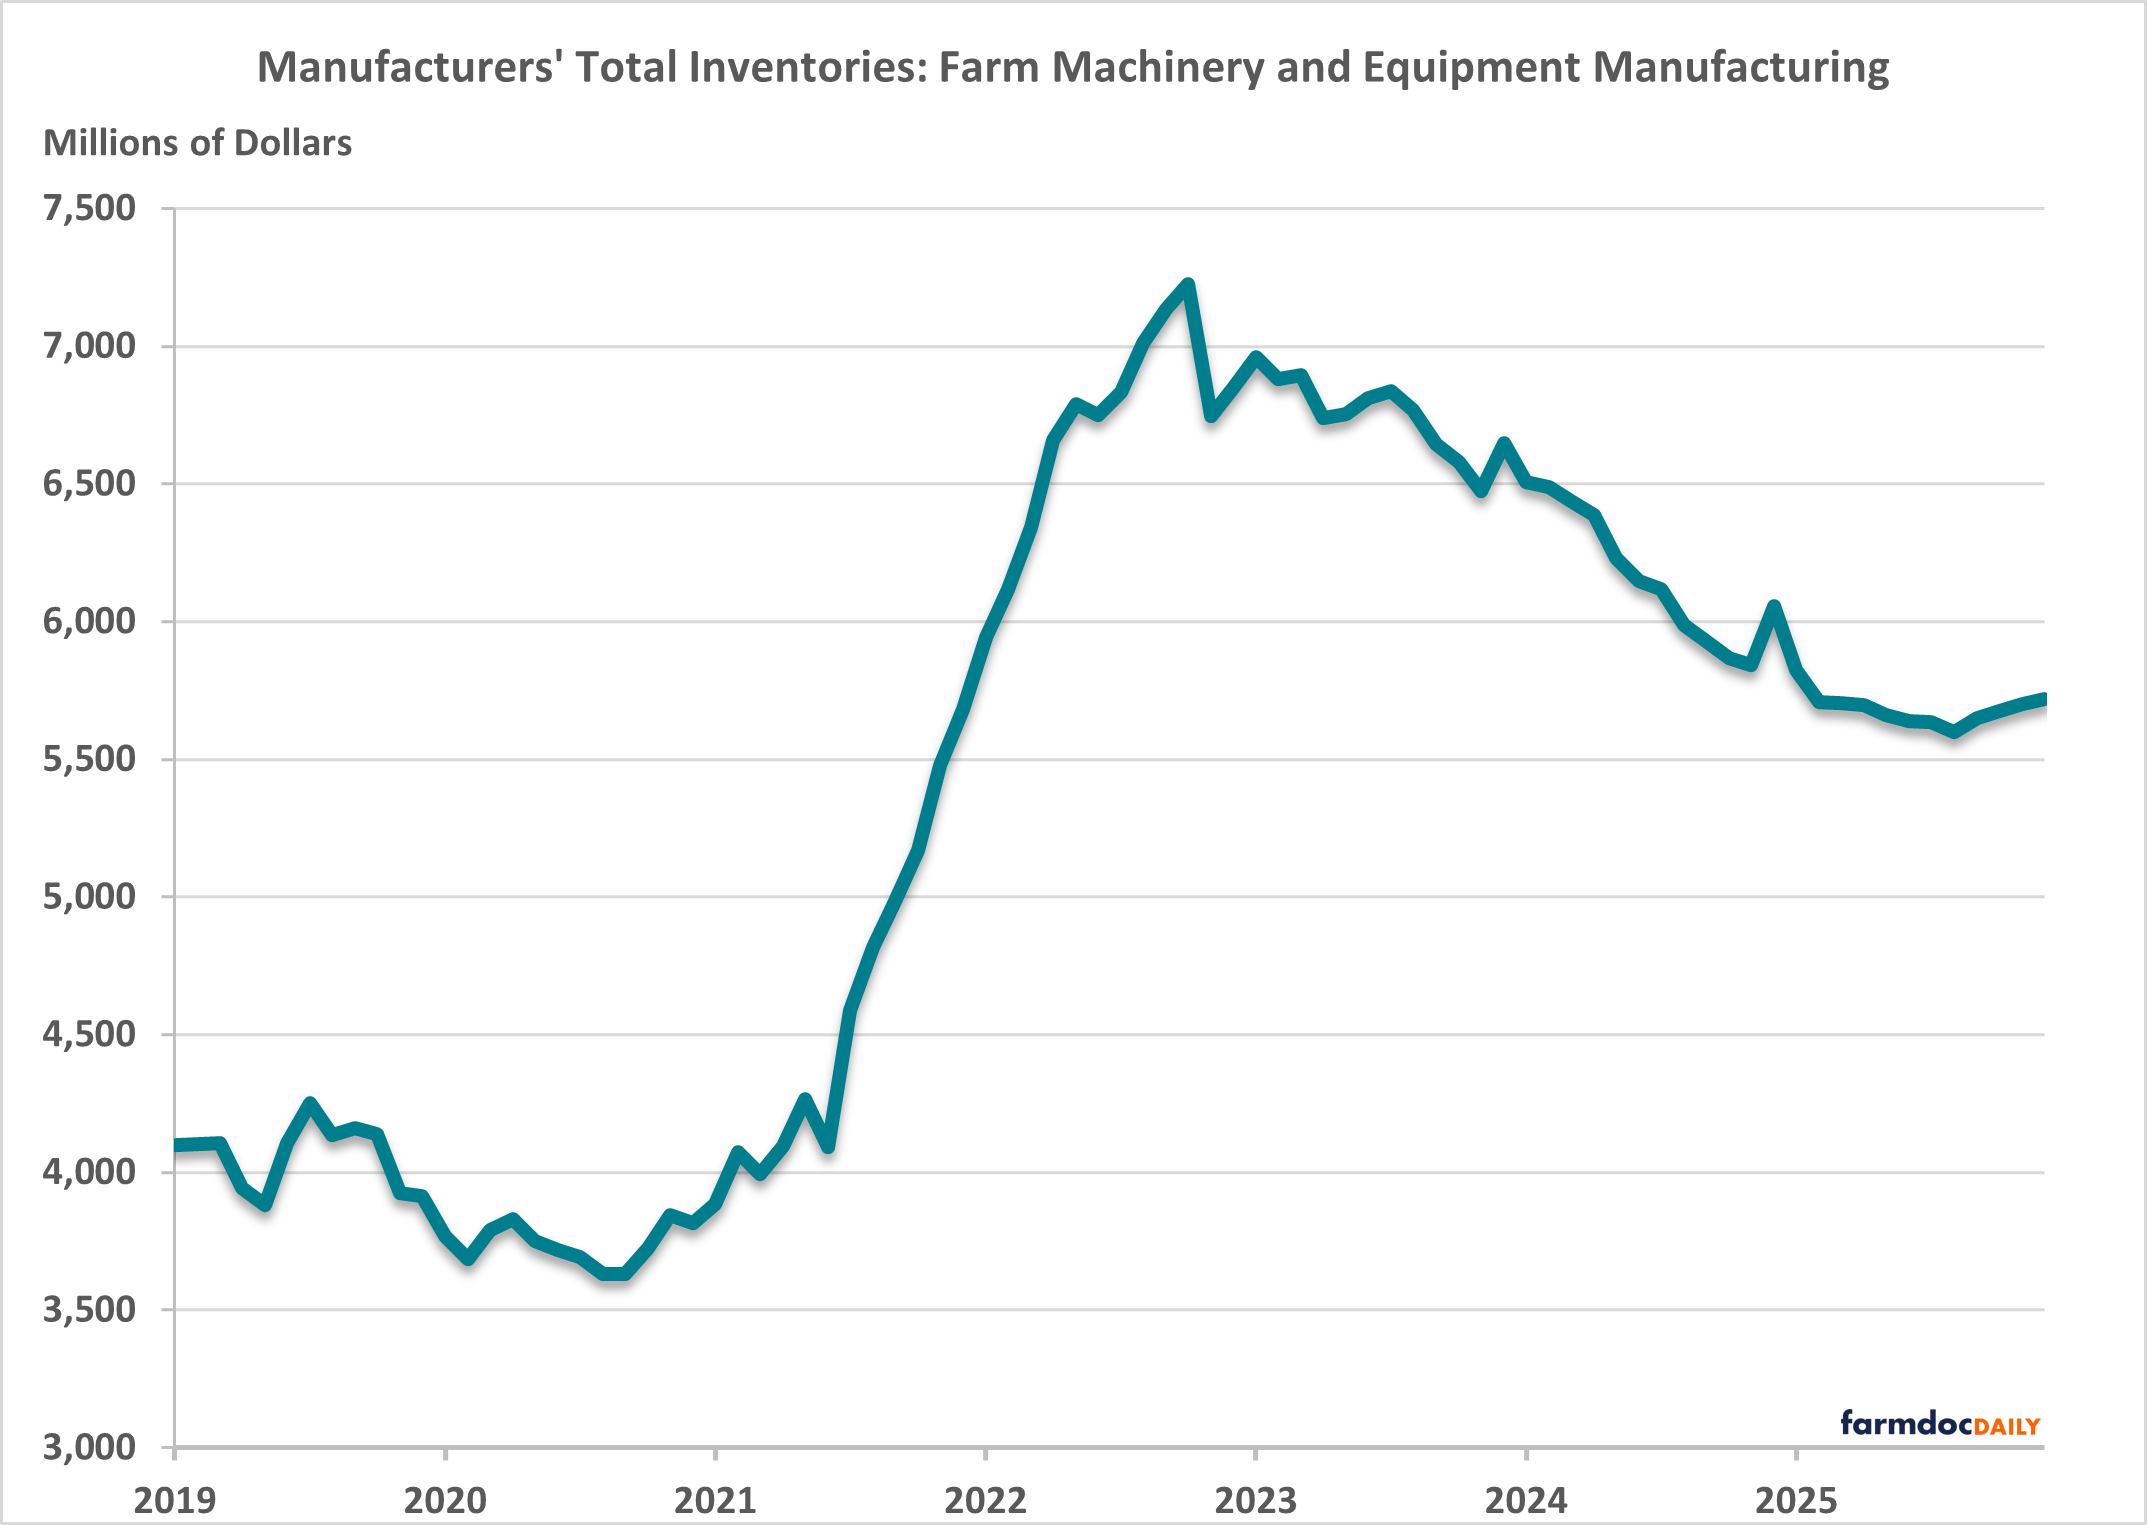
Manufacturers have scaled back production to bring dealer inventories back in line with demand. According to data from the U.S. Census Bureau, the seasonally adjusted value of total farm machinery and equipment inventories (see FRED: A33ATI) peaked at approximately $7.23 billion in October 2022 and has declined steadily since then. By December 2025, inventories had fallen to $5.72 billion, representing a 20.84% decrease, or a reduction of $1.51 billion, from the October 2022 peak. However, the value of inventories has been rising in recent months as shown in Figure 2.
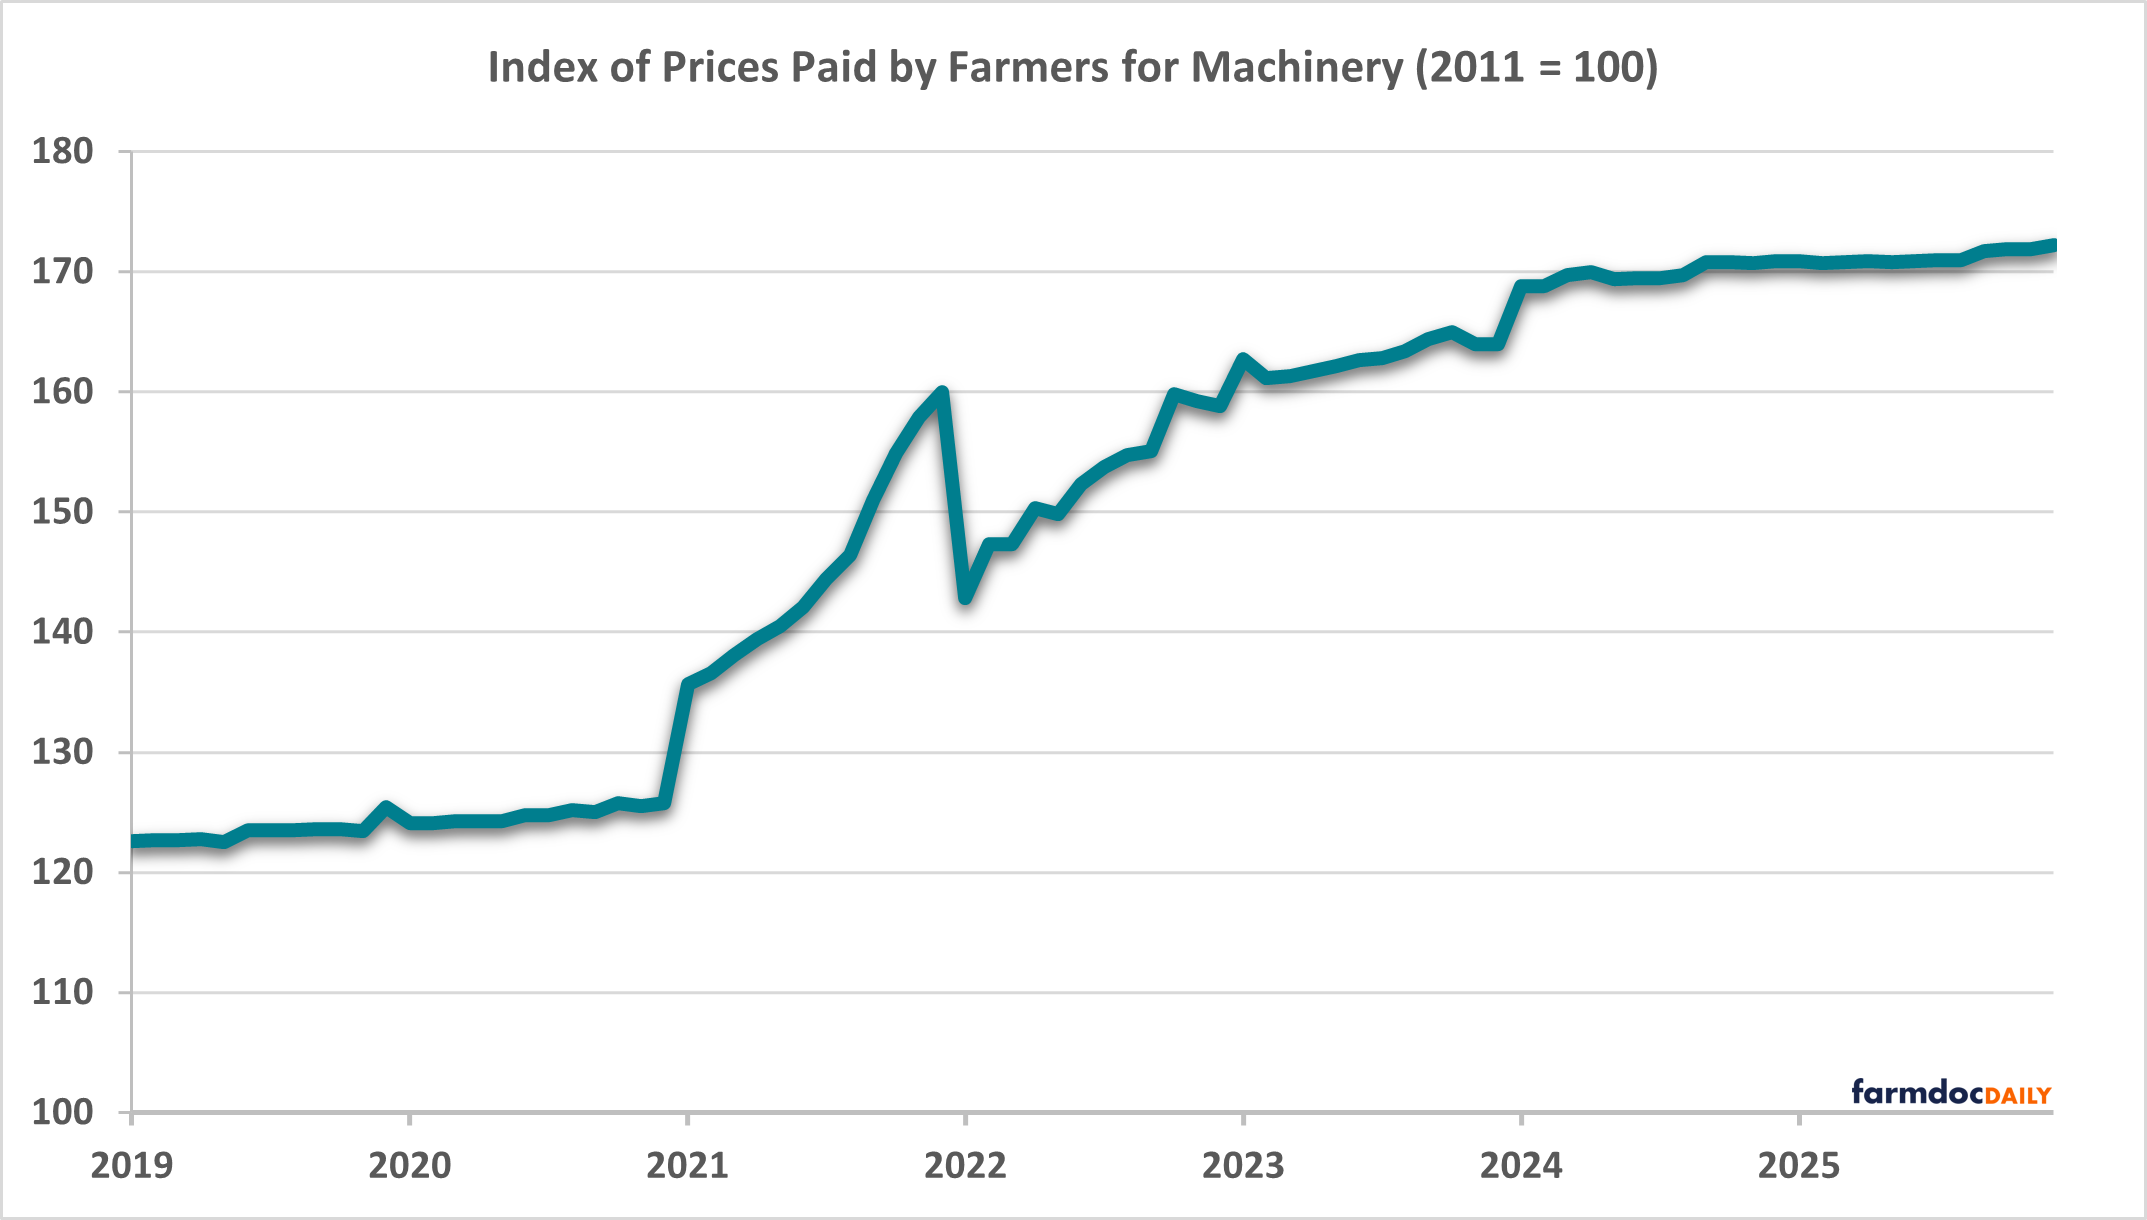
Despite the decline in sales, machinery and equipment prices remain high. According to the USDA’s Agricultural Prices report by the National Agricultural Statistics Service (NASS) (see NASS Agricultural Prices December 2025), the index for Machinery Prices Paid by farmers in December increased by 0.8% on a year-over-year basis, and by 0.2% from the previous month. However, Figure 3 shows how elevated machinery prices currently are relative to the beginning of the COVID-19 pandemic. The sharp rise in prices at that time was driven by supply chain disruptions and shortages of key inputs, such as steel and microchips, which restricted production and drove up manufacturing costs. Additionally, strong grain prices and farm incomes contributed to the rise in farm machinery and equipment demand in that period. More recently, however, we have seen price increases level off as declining grain prices and farm incomes, along with higher borrowing and input costs, have dampened demand.
Lastly, the 2025 trade environment introduced massive margin pressures on manufacturers. In its recent financial disclosures, Deere & Co. reported absorbing approximately $600 million in tariff costs during fiscal year 2025. Furthermore, the company is projecting these expenses to double to roughly $1.2 billion in fiscal year 2026, at a run rate of $300 million a quarter (see Deere & Co. Q4 2025 Earnings Call). Similarly, CNH Industrial N.V. reported that tariff costs contributed to its agriculture business segment’s adjusted earnings before interest and taxes (EBIT) declining from $1.47 billion in 2024 to $772 million in 2025 (see CNH Industrial N.V. Form 10-K, December 2025).[2] AGCO Corporation also reported an expected tariff burden of up to $110 million in 2026 compared to the $40 million they incurred in 2025 (see AGCO Corporation Earnings Call). However, manufacturers may see substantial relief following the U.S. Supreme Court’s February 20, 2026 ruling in Learning Resources, Inc., et al. v. Trump, which struck down the administration’s use of the International Emergency Economic Powers Act (IEEPA) to unilaterally impose these tariffs. If manufacturers can successfully secure refunds for the duties already paid and avoid future levies, then it would lift a massive cost burden and mitigate the pricing pressures they have all forecasted for the remainder of the year.
Conclusion
The farm machinery and equipment market continues to grapple with headwinds. With sales for both new and used units remaining contracted, manufacturers are scaling back production to better align inventories with cooling demand. While price increases have leveled off, prices remain elevated relative to pre-pandemic levels. These factors—compounded by the margin pressures introduced by the 2025 tariffs—suggest a prolonged downturn as farmers navigate challenging production and credit conditions. While the U.S. Supreme Court’s February 2026 ruling provided a brief window of relief by striking down emergency-based tariffs, the Trump administration’s immediate pivot to a new 10% (potentially rising to 15%) tariff under Section 122 has reignited trade policy uncertainty. Ultimately, the extent and pace of any market recovery will depend on a rebound in grain prices, improved farm incomes, lower borrowing costs, and the resolution of ongoing trade policy uncertainty.
[1] These ten states include Colorado, Illinois, Iowa, Kansas, Minnesota, Missouri, Nebraska, North Dakota, South Dakota and Wyoming.
[2] Adjusted EBIT is a non-Generally Accepted Accounting Principles (GAAP) financial metric that takes a company’s earnings before interest and taxes (EBIT) and adds back non-recurring, irregular, or one-time expenses (e.g., restructuring costs, litigation fees, asset impairments). It normalizes earnings to reflect core operating performance, allowing for better comparisons across periods or with peers.
References
AGCO Corporation. (2026, February 5). AGCO Corporation Q4 2025 earnings conference call transcript. https://investors.agcocorp.com/events/event-details/q4-2025-agco-earnings-conference-call
Association of Equipment Manufacturers. "U.S. Ag Tractor and Combine Reports." https://www.aem.org/market-share-statistics/us-ag-tractor-and-combine-reports/
CNH Industrial N.V. 2026. Annual Report on Form 10‑K for the year ended December 31, 2025. CNH, London. Available at: https://investors.cnh.com/financials/sec-filings/default.aspx. Accessed February 27, 2026.
Creighton University. "Rural Mainstreet Index." Mainstreet Economy Report. https://www.creighton.edu/economicoutlook/mainstreeteconomy
Deere & Company. 2025. “Fourth Quarter 2025 Earnings Call Transcript.” Investor Relations, Deere & Company, November 26, 2025. Available at: https://s22.q4cdn.com/253594569/files/doc_financials/2025/q4/DE-4Q-Earnings-Call-Transcript.pdf
Thomas, S. "2026 Ag Equipment Dealer Business Outlook & Trends Report Highlights and Analysis." Upstream Ag Insights, January 10, 2026. https://upstream.ag/p/2026-ag-equipment-dealer-business-outlook-trends-report-highlights-and-analysis
Mashange, G. "The Current State of the Farm Machinery and Equipment Market." farmdoc daily (15):197, Department of Agricultural and Consumer Economics, University of Illinois at Urbana-Champaign, October 24, 2025. https://farmdocdaily.illinois.edu/2025/10/the-current-state-of-farm-machinery-and-equipment-market.html
Sandhills Global. “Tractors U.S. Used Market.” Sandhills Global Market Report, December 2025. Available at: https://sandhills.showpad.com/share/qhCxD2aYG5JoqYHCpe03u
Sandhills Global. “Combines U.S. Used Market.” Sandhills Global Market Report, December 2025. Available at: https://sandhills.showpad.com/share/qhCxD2aYG5JoqYHCpe03u
U.S. Census Bureau, Manufacturers' Total Inventories: Farm Machinery and Equipment Manufacturing [A33ATI], retrieved from FRED, Federal Reserve Bank of St. Louis; https://fred.stlouisfed.org/series/A33ATI, February 26, 2026.
U.S. Department of Agriculture, National Agricultural Statistics Service. "Agricultural Prices." January 30, 2026. https://esmis.nal.usda.gov/sites/default/release-files/795747/agpr0126.pdf
Disclaimer: We request all readers, electronic media and others follow our citation guidelines when re-posting articles from farmdoc daily. Guidelines are available here. The farmdoc daily website falls under University of Illinois copyright and intellectual property rights. For a detailed statement, please see the University of Illinois Copyright Information and Policies here.