








Average Illinois Cash Rents and Soil Productivity in 2026
Since 2017, we’ve provided annual updates to a simple formula for calculating the average cash rent for a piece of farmland based on its average soil productivity and location within in Illinois (see farmdoc daily from November 7, 2017). Today’s article provides the latest in this series of updates to reflect the relationship between rental rates in Illinois for 2026, soil productivity, and location in the state. Individuals can apply this formula to their farms. It will provide an average cash rent based on data from the National Agricultura Statistics Service (USDA-NASS). Rents can vary greatly from the averages presented in this article. We caution readers that additional factors not included in this simple statistical model will affect fair and appropriate rental rates.
Average County Cash Rents in Illinois for 2026
USDA-NASS recently released average county cash rent estimates based on farmer survey responses. Average county rents for Illinois are provided in Figure 1 which are discussed in more detail in the farmdoc daily article published on September 15, 2026.
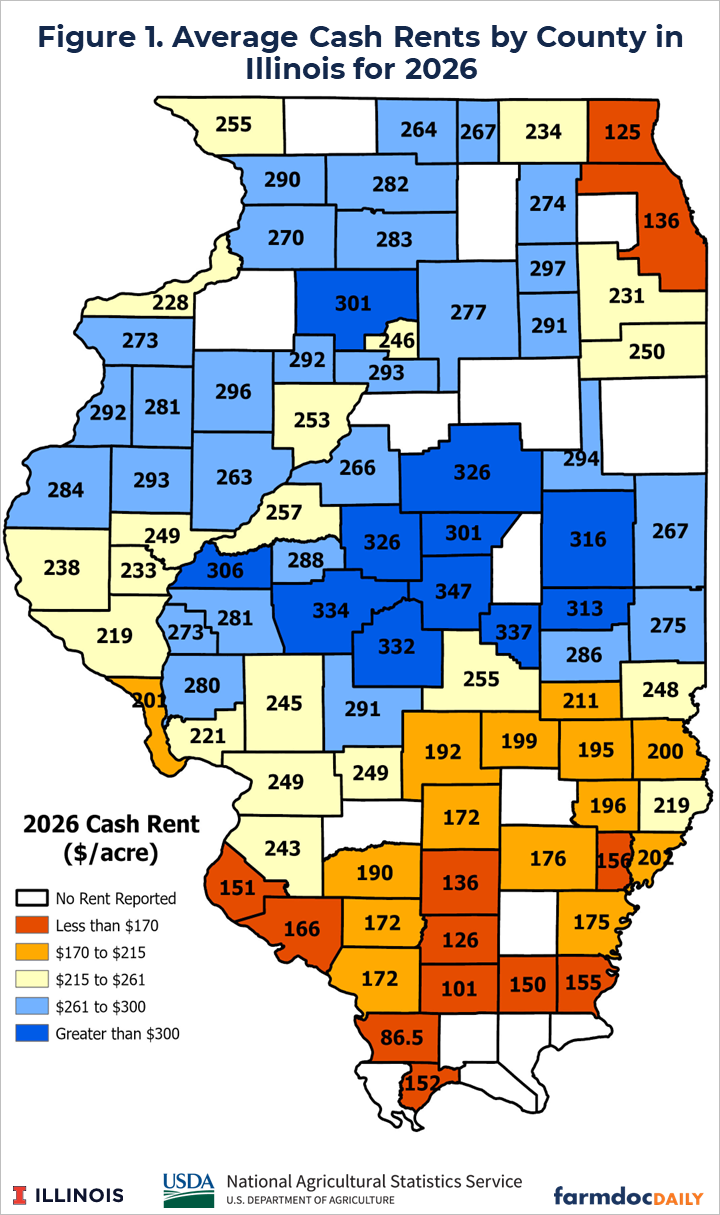
The average cash rental rate for the state of Illinois was $261 per acre in 2026, down from $264 in 2025 and $269 in 2026. USDA provided county-level estimates for 86 of the 102 counties in Illinois for 2026. County average rental rates ranged from a low of $86.50 per acre in Union county in southern Illinois to a high of $347 per acre in Macon county in central Illinois.
Soil Productivity Index
Soil productivity indexes (PIs), published in Bulletin 811 – Optimal Crop Productivity Ratings for Illinois Soils, are often used as a measure which quantifies the productivity or yield potential of the different soil types in Illinois. This publication provides PIs for these different soil types, which are positively correlated with realized corn and soybean yields through time.
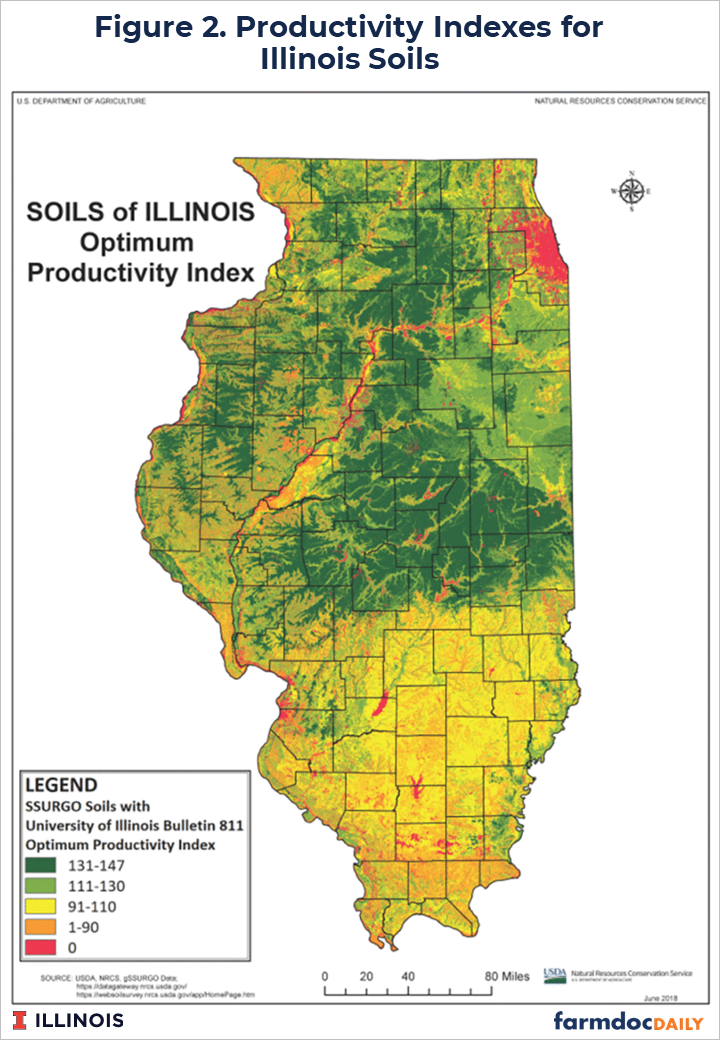
Figure 2 shows a map provided by the National Resources Conservation Service (NRCS) of PIs across Illinois, with dark green colors indicating higher PIs and yellow and red colors associated with lower PIs. As expected, the highest PIs are located in east-central, west-central, and northern Illinois. The counties with the highest PIs are Piatt (east central with 138 PI), Macon (east central with 137 PI), Champaign (east central with 136 PI), Logan (east central with 135 PI), and DeKalb (northern with 135 PI). The counties with the lowest average PIs are located in southern Illinois: Williamson (85 PI), Calhoun (89 PI), Johnson (91 PI), Perry (92 PI), and Monroe (94 PI).
Average Cash Rents, PIs, and Location
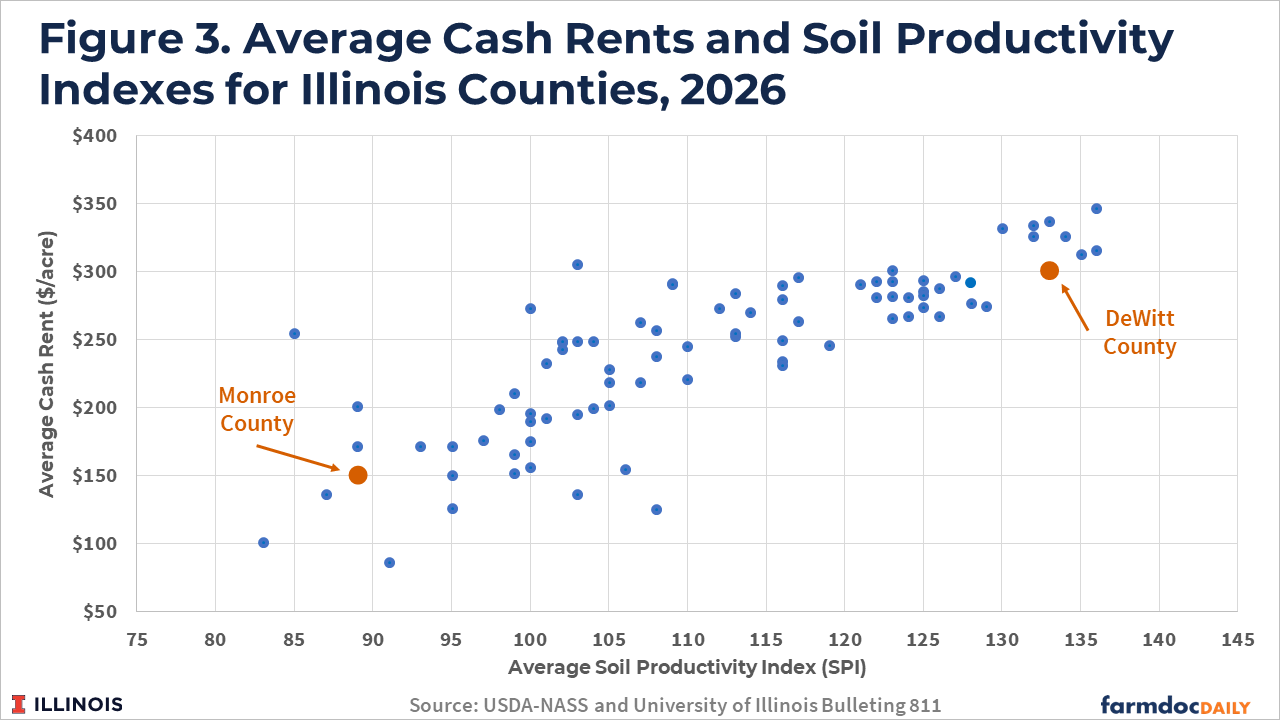
Figure 3 provides a scatterplot that illustrates the relationship between average cash rents and PIs for counties in Illinois for 2026. Average cash rents are generally higher in counties with higher average soil productivity ratings. Two counties are specifically highlighted in Figure 3. Monroe county, located in southwestern Illinois, has an average PI of 89 and an average cash rent estimated at $151 per acre for 2026. DeWitt county, located in central Illinois, has an average PI of 133 and an average cash rent estimated at $301 per acre for 2026.
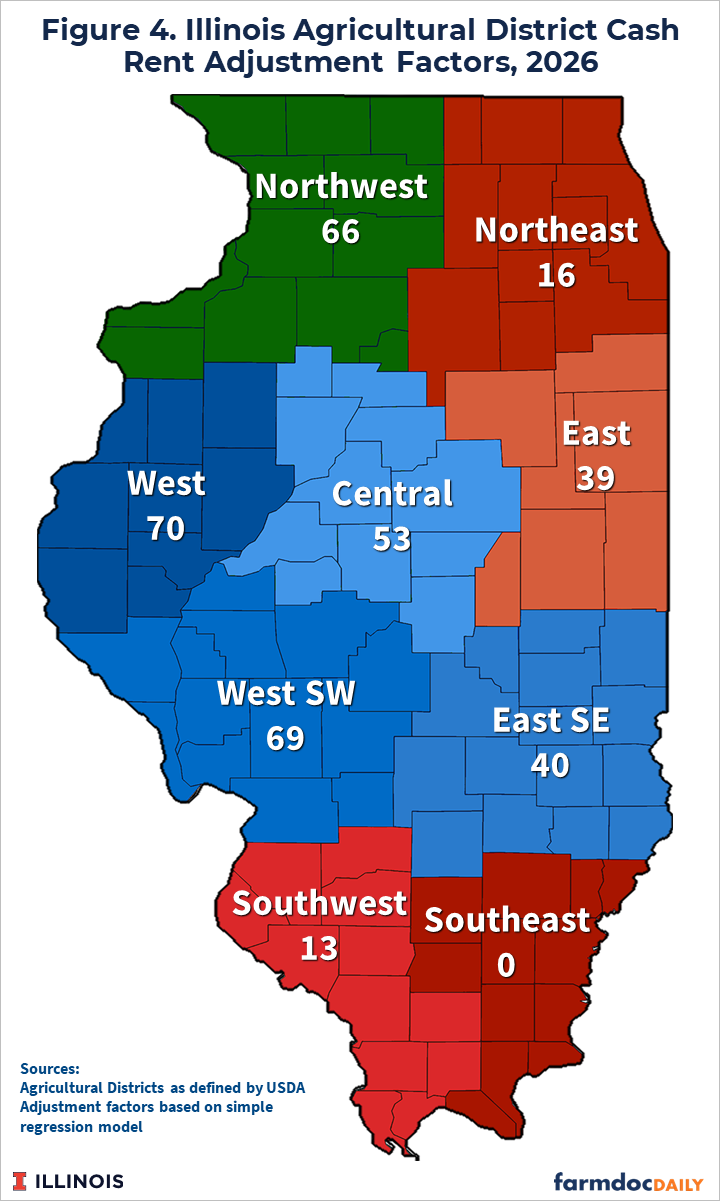
Location is another factor that is often cited as being related to cash rents. Here, we measure location using USDA’s definition of Agricultural Districts (ADs). USDA ADs are multi-county areas within a state. In Illinois there are 9 ADs – Northwest, Northeast, West, Central, East, West Southwest, East Southeast, Southwest and Southeast (see Figure 4). A host of factors other than soil productivity could cause rents to vary by region. Weather varies from northern to southern Illinois, with the northern region experiencing more stable and less variable crop production conditions. Competitive pressures among farmers for rented land may vary across regions in Illinois. Locations and the number of grain outlets and input suppliers could also influence profits and thus the cash rent that is paid.
Using PIs and ADs to measure location, we estimate a simple linear regression model for average county cash rents in Illinois. The formula resulting from this simple regression model for 2026 is:
Estimated Average Cash Rent = -136 + (3.01*PI) + AD Adjustment Factor
The estimated AD adjustment factors for 2026 are provided in Figure 4.
The formula can be used to arrive at an estimate for an average cash rent for a piece of farmland that would make it in line with the observed relationship between average cash rents, soil productivity, and location in the state. As an example, consider a piece of farmland located in Champaign County Illinois with an average PI of 130. Champaign county is in the East AD, so the adjustment factor is $39 per acre. The formula results in an estimated cash rent of $294 per acre (-136 + 3.01*130 + 39 = 294).
Discussion
While the relationship between soil productivity, location, and average cash rents in Illinois is statistically strong, it remains imperfect. The R2 measure for the regression model used to define the formula is 0.82, suggesting that 82% of the variation observed in average county cash rents is explained by the average soil productivity and location of the county. That leaves 18% of the variation in average rents that is explained by other factors.
In practice, this means that actual rents will vary from those estimated by the formula, and those variations can be quite large. The example farm in Champaign County with an PI of 130 has a formula-based rental estimate of $294 per acre. In practice, farms with that productivity level in central Illinois could have rents that are $100 or more per acre above or below that average level based on other factors.
There are several reasons why cash rents vary from one parcel to another. Some of the differences will be related to the attributes of the farmland, including:
- Size of fields within the parcel. Farms that have larger fields will generally be preferable and receive higher cash rents. Small parcels with fields below 40 acres in size could receive lower cash rents.
- Farms with excellent drainage will typically receive higher cash rents than those with drainage issues.
- High-risk farms. High-risk areas often are near creeks and rivers that are prone to flooding. Farms that have high-risk areas will likely receive lower rents.
- Farms with varying soil types. Having similar soils throughout a field makes it easier for the farmer to manage. Fewer soil types in a field will result in higher cash rents.
- Farms with topography. A great deal of topography on a farm can result in lower cash rents. Farms that require contour planting are more challenging to manage. Farms could also have low spots that will collect water in high-moisture years. Those low spots could result in drowned outs and low yields.
- Farms near grain delivery points and input suppliers. Lower costs can occur for farms near grain delivery points and input suppliers, resulting in higher cash rents.
- Obstructions in the fields. Fields that have obstructions that need to be “farmed around” will be less preferred and may receive lower rents. Obstructions can include waterways, farmsteads, electrical power lines, wind turbines, and cell towers.
- Shape of the fields. Generally, square and rectangular fields are preferred to those with irregular boundaries.
The desires of the landowner also play a role in determining the cash rent level. Landowners who place no land-use restrictions on the farmer and do not wish to impose any constraints on farming practices can expect higher cash rent. In contrast, landowners who desire their farmer tenant to implement specific practices can expect lower cash rents.
Cash rents are also influenced by the services offered by the farmer. Some farmers provide a great deal of maintenance to the property, including upkeep of waterways and other conservation structures. Additional services may lower the cash rent.
Finally, some landowners are greatly concerned that farmers generate sufficient income from the property, with “sufficient” being somewhat ambiguous. Other landowners are not concerned with the level of return going to the farmer. Landowners concerned about farmer return, often intertwined with reasons noted in the two previous paragraphs, are willing to take a lower cash rent.
Finding the PI for a Farm
Many landowners already know the PI for the farm. In these cases, it is relatively straightforward to arrive at the estimated rent using the above formula.
In other cases, the landowner does not know the PI but has a list of acres and soil types on the farm. In this case, the farmer can find the PIs by soil type in Table S2 in Bulletin 811 (see farmdoc daily article from October 7, 2026 for an example calculation for a farm based on multiple soil types).
In some cases, a landowner will not have the PI or soil types for a farm. These can be obtained online using a Web Soil Survey tool. Landowners or farmers can locate a farm as an “area of Interest” within the tool. Once identified, soil types for that “Area of Interest” will be detailed.
Previous Years’ Estimates
The formulas for earlier years are available in these farmdoc daily articles:
- 2017: November 7, 2017
- 2020: September 15, 2020
- 2021: September 7, 2021
- 2022: September 13, 2022
- 2023: September 5, 2023
- 2024: September 3, 2024
- 2025: October 7, 2025
Summary
A formula relating average cash rents to soil productivity and location in Illinois has been updated using average county cash rent information from 2026. The formula can serve as a useful guide, or starting point, for an appropriate cash rent based on a piece of farmland’s soil productivity and location. However, we caution readers that actual cash rents in practice can vary significantly from the estimated average that the formula will provide, often for reasons also discussed in this article.
References
Paulson, N., G. Schnitkey, J. Tsay and C. Zulauf. "Illinois Cash Rents in 2026 and Outlook for 2027." farmdoc daily (16):165, Department of Agricultural and Consumer Economics, University of Illinois at Urbana-Champaign, September 15, 2026.
Schnitkey, G., N. Paulson and C. Zulauf. "Relationships between Average Cash Rents and Soil Productivity." farmdoc daily (15):184, Department of Agricultural and Consumer Economics, University of Illinois at Urbana-Champaign, October 7, 2025.
Disclaimer: We request all readers, electronic media and others follow our citation guidelines when re-posting articles from farmdoc daily. Guidelines are available here. The farmdoc daily website falls under University of Illinois copyright and intellectual property rights. For a detailed statement, please see the University of Illinois Copyright Information and Policies here.