








Rethinking Phosphorus and Potassium, Part 3: Economics
Key Takeaways
Grain nutrient concentrations can vary across the farm and may provide an opportunity to cut input costs this fall. Soil test values can vary due to sampling time and lab procedures; it may be worthwhile to monitor the variability of soil test values by sampling at different timepoints post-harvest and sending the same sample (labeled differently) to the lab before committing to a fertilization strategy this fall. Consider evaluating economic return to phosphorus (P) and potassium (K) applications, not just potential yield response this fall, whether that be via an unfertilized or reduced rate check strip, grain sampling for precise maintenance rates, or partial drawdown on applicable acres. Rethinking standard P and K management practices can provide a greater understanding of recommendations and improve economic returns.
Refreshing Important Topics
As we enter the final part of this series focused on reinvestigating current P K management paradigms, let us revisit the key points established thus far. In Part 1 we covered the origins and use cases of soil tests: in short, soil tests for P and K (e.g., Mehlich-3) are operational tools used to estimate crop yield response probability to P or K applications and do not represent a literal amount of “available nutrient” in the soil (see farmdoc daily from June 29, 2026). Arguably, soil tests should be interpreted first and foremost based on net return ($/ac), not yield response (bu/ac). Soil tests have afforded much needed improvements in P and K management in the latter 20th century but are unlikely to be the sole tool to carry us forward in the 21st century. Part 2 covered the importance of grain nutrient concentrations and crop removal rates to all three P and K management strategies based on soil test levels, “build”, “maintain”, or “drawdown” and imperfections in soil tests for tracking soil nutrient levels – arguably, an “off-label” use of soil tests rife with inaccuracy, imprecision and thus economically questionable (see farmdoc daily from July 27, 2026). Despite recommended handbook values, also known as grain nutrient or removal coefficients (lb P2O5 or K2O/bu), variability in grain P and K within and among Midwestern states impacts the accuracy of crop nutrient removal rates and thus the accuracy of fertilizer application strategies.
Terminology definitionsGrain nutrient concentrations = measured amount (lbs/bu) of P2O5 or K2O in grain, synonym with grain removal concentration Grain nutrient coefficients = recommended grain nutrient concentration to estimate crop removal rates statewide, found in publications like the Illinois Agronomy Handbook, synonym with grain removal coefficients |
Implications of Variability
Variability is ubiquitous in agriculture and in particular soil fertility, meaning that it is important to quantify how and why something varies for more effective management. The grain nutrient coefficients in the Illinois Agronomy Handbook are 75th percentile values, deemed to be “safe” and ensure that recommendations are adequate for a majority of fields. While this approach has served Illinois agriculture well in past decades, improvements in technology along with current economic constraints and environmental considerations demand future recommendations be increasingly tailored to individual field management.
In Part 2 we highlighted the distribution of grain P and K concentrations without showcasing the impact that variation in concentrations can have on estimated crop nutrient removal rates (per acre basis). While accurate nutrient removal rates are important for all three fertilizer application strategies, a maintenance strategy may offer the greatest economic returns. Maintenance strategies seek to prevent future yield losses by maintaining soil fertility levels, however current yields are not dependent on the fertilizer applied in these scenarios. For this reason, drawdown – temporary mining of soils by applying less than what was removed with harvest – is a viable option. If full drawdown seems too risky, consider a small cutback (e.g., 25% less, to 75% of maintenance) as a check strip. Similar to a drawdown management strategy, several years of maintenance applications could be forgone before yields are impacted, depending on soil test values. While the long-term value of maintenance applications to preserve soil fertility levels is important, this long-term focus could mean forfeiting economic returns from maintenance applications in the short term.
The table below shows the difference in total nutrient removal per acre and economic returns for a single season and after ten years of a corn-soybean rotation, based on >4,900 samples from elevators across Illinois sampled during 2014-2017 (Villamil et al., 2019). While annual differences in removal rates may seem relatively minor, consider (1) the annual economic impact across many acres, and (2) the long-term economic return of cashing in on “surplus” fertility at a point when input prices are high. Why build up the soil bank account if not to use it in tough economic year(s)? As this soil bank account of ‘available’ P and K does not track 1:1 with fertilizer P and K inputs, this “surplus” is difficult to monitor and easily overlooked.
| a – Annual Removal Rate (lbs/ac) by Crop & Nutrient | ||||
| Percentile | P2O5 | K2O | ||
| Corn | Soybeans | Corn | Soybeans | |
| 75th | 89 | 57 | 58 | 90 |
| 50th | 82 | 54 | 55 | 84 |
| 25th | 75 | 51 | 53 | 81 |
| b – Annual Delta Comparison (lbs/ac) | ||||
| Percentile | P2O5 | K2O | ||
| Corn | Soybeans | Corn | Soybeans | |
| 50th vs 75th | 7 | 3 | 2 | 5 |
| 25th vs 75th | 14 | 6 | 5 | 8 |
| c – Annual Cost of “Surplus” ($/ac) | ||||
| Percentile | P2O5 | K2O | ||
| Corn | Soybeans | Corn | Soybeans | |
| 50th vs 75th | $ 7.07 | $ 2.97 | $ 1.00 | $ 2.22 |
| 25th vs 75th | $ 14.15 | $ 5.95 | $ 2.01 | $ 3.48 |
| d – 10 Year Rotation “Surplus” (lbs/ac) | ||||
| Percentile | P2O5 | K2O | ||
| 50th vs 75th | 51 | 39 | ||
| 25th vs 75th | 103 | 66 | ||
| e – Single Year Removal as Percentage of 10 Year “Surplus” | ||||
| Percentile | P2O5 | K2O | ||
| Corn | Soybeans | Corn | Soybeans | |
| 50th vs 75th | 63% | 95% | 70% | 46% |
| 25th vs 75th | 125% | 190% | 119% | 78% |
| f – 2026 Value of 10yr accumulation ($/ac) | ||||
| Percentile | P2O5 | K2O | Total | |
| 50th vs 75th | $ 50.23 | $ 16.10 | $ 66.34 | |
| 25th vs 75th | $ 100.47 | $ 27.46 | $ 127.93 | |
Table 1. Panel a: Annual crop removal rates of P2O5 and K2O by crop for 25th, 50th, 75th percentiles of grain nutrient concentrations. Yields for Central Illinois – High Productivity (241 bu/ac corn, 76 bu/ac soybeans) from 2026 Illinois Crop Budgets (see farmdoc daily from May 19, 2026). Panel b: Differences in crop removal from 75th vs 50th and 75th vs 25th percentiles for each crop and nutrient. Panel c: Cost per acre of percentile comparisons using $900/ton DAP ($0.98/lb P2O5) and $500/ton Potash ($0.48/lb K2O). Panel d – Fertility “surplus” for percentile comparisons by nutrient after 10 years in a corn-soybean rotation assuming consistent removal rates & yields (5 years corn, 5 years soybeans). Panel e – Single year removal rates as a percentage of 10 year “surplus” (i.e. how much of a single crop’s removal is accounted for after 10 years). Panel f – Value of 10 year “surplus” if purchased at fertilizer prices listed above (value of fertilizer “credit”). Additional data from Villamil, 2019.
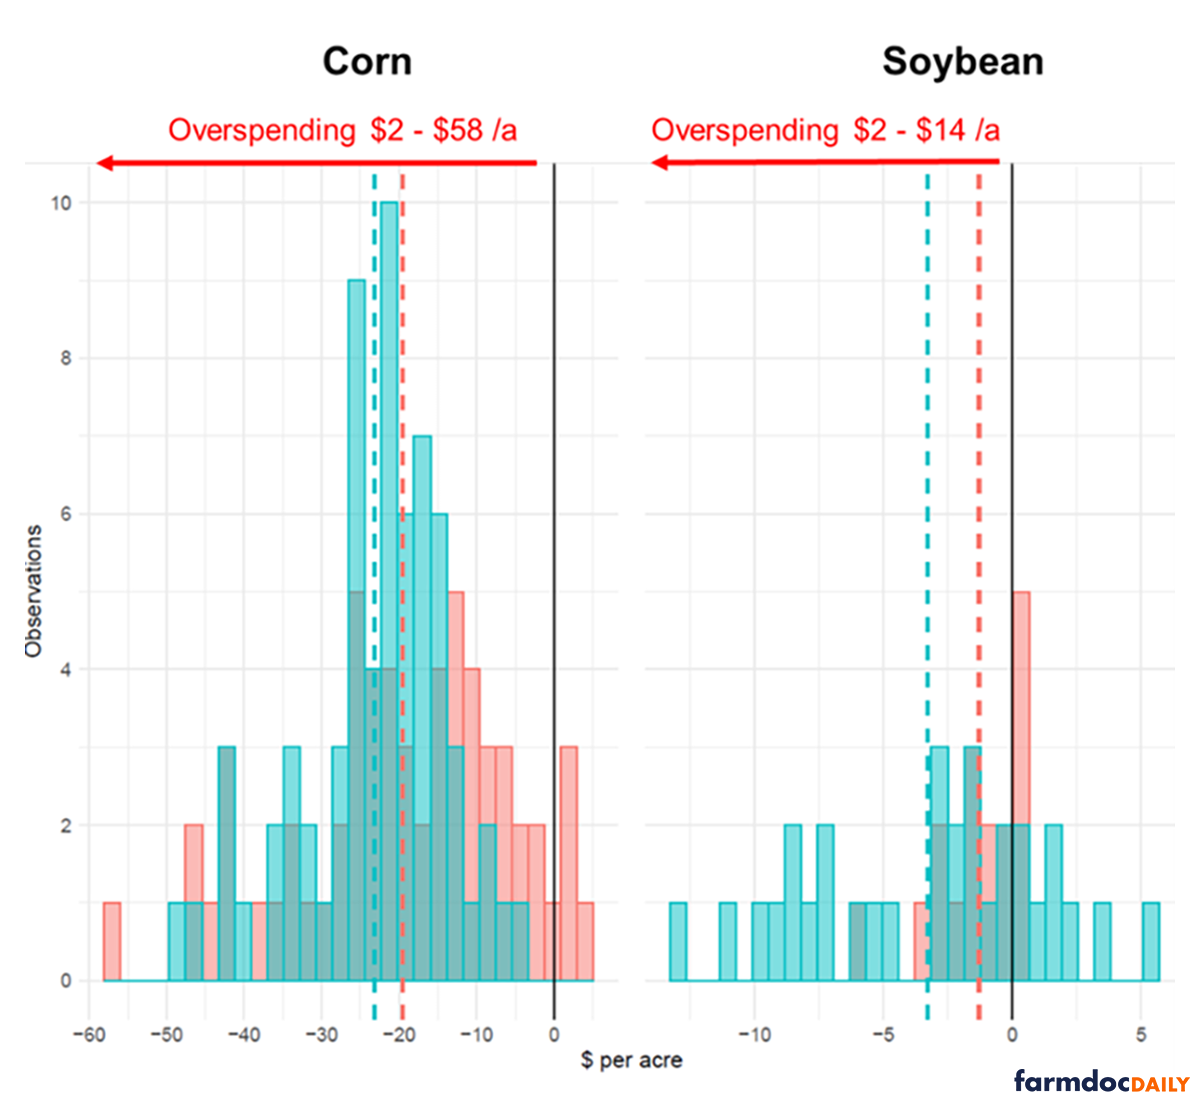
Irrespective of fertilizer application strategy, one can see clear returns simply from utilizing the average (50th percentile) grain nutrient coefficient instead of the 75th percentile. While it is more likely that a field will have grain nutrient concentrations closer to the 50th percentile than the 75th, all grain nutrient concentrations across the distribution shown previously are from measurements conducted on commercial fields in Illinois. This means that grain nutrient concentration can vary both within and across fields of a farm. How and why these numbers vary is not yet well understood, but are likely influenced by soil properties, genetics and weather. Below is an example of “overspending” per acre from intra-field grain sampling in Bureau County, comparing the cost difference of maintenance application rates calculated from measured grain removal in-field versus assumed grain removal.
Intra-Field Variability
In addition to variability within grain nutrient concentrations between fields or across a region, grain nutrient concentration can also vary within a field. This can impact assumed nutrient removal rates if variable rate applications are being used, therefore addressing this can help improve variable rate approaches at the field and sub-field level. If P and K management changes in specific portions of a field based on crop nutrient removal (i.e. adjusting maintenance application rates based on yield level), why not consider grain nutrient concentration within the field as well? As shown below, different portions of this 70-acre field in Bureau County had varying degrees of “surplus” P applied, leading to significant “overspending” on P in specific areas of the field.
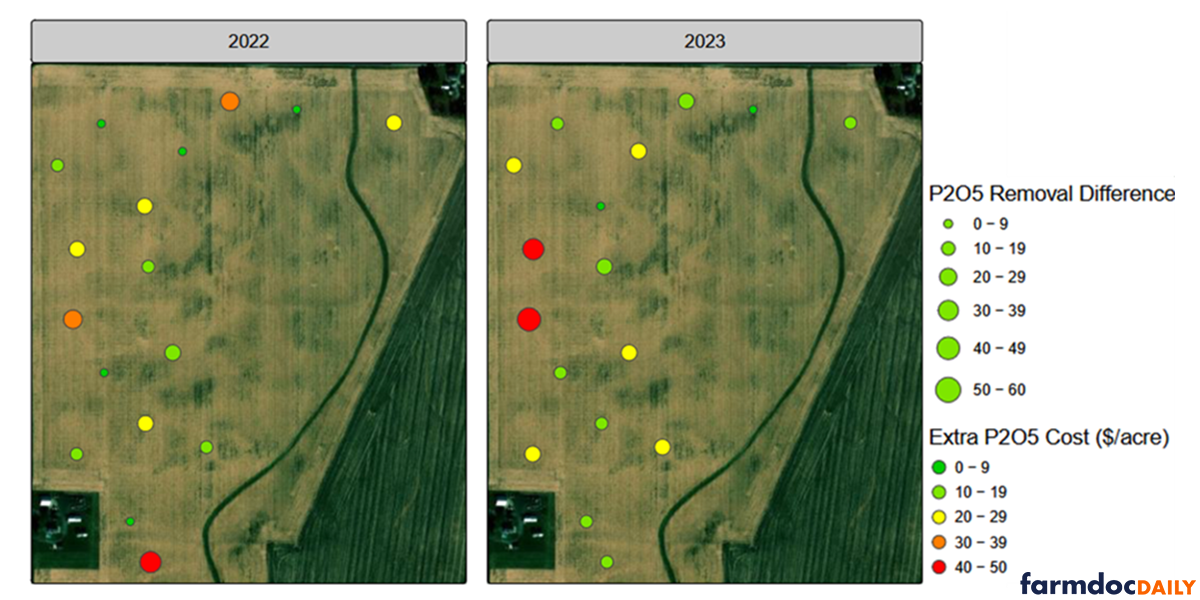
While these sub-field discrepancies may exist, it is also important to consider tradeoffs between sampling intensity and return on investment when considering measuring grain sample removals. Grid soil sampling post-harvest is physically easier than grain sampling. What then is the optimum grain sampling density to cost-effectively determine nutrient removal from a field (or sub-field zones)? While research on this topic is underway, the example above can give some insights into the potential tradeoffs between the accuracy of grain removal coefficients and sampling intensity and costs of grain sampling and analysis.
Economic Returns to P and K
While precision maintenance applications based on grain nutrient concentrations have potential to improve farm profitability, the short-term profitability of P and K applications merit consideration. As covered in Part 1, soil test critical values (CSTV) are used to determine the probability of crop yield being limited by P or K. As these values are based on yield response probability, there is no consideration of whether the yield response is economical in current CSTV recommendations. In fact, any economic consideration of CSTV will by definition be non-static, fluctuating with DAP, potash and grain prices. This is precisely why the maximum return to nitrogen (MRTN) calculator uses an approach where crop and input prices dictate nitrogen application rate recommendations. A similar framework can and should be applied to P and K. The examples below from Iowa State University show how economic returns to P or K change based on crop prices at a constant fertilizer price (Mallarino, 2026).
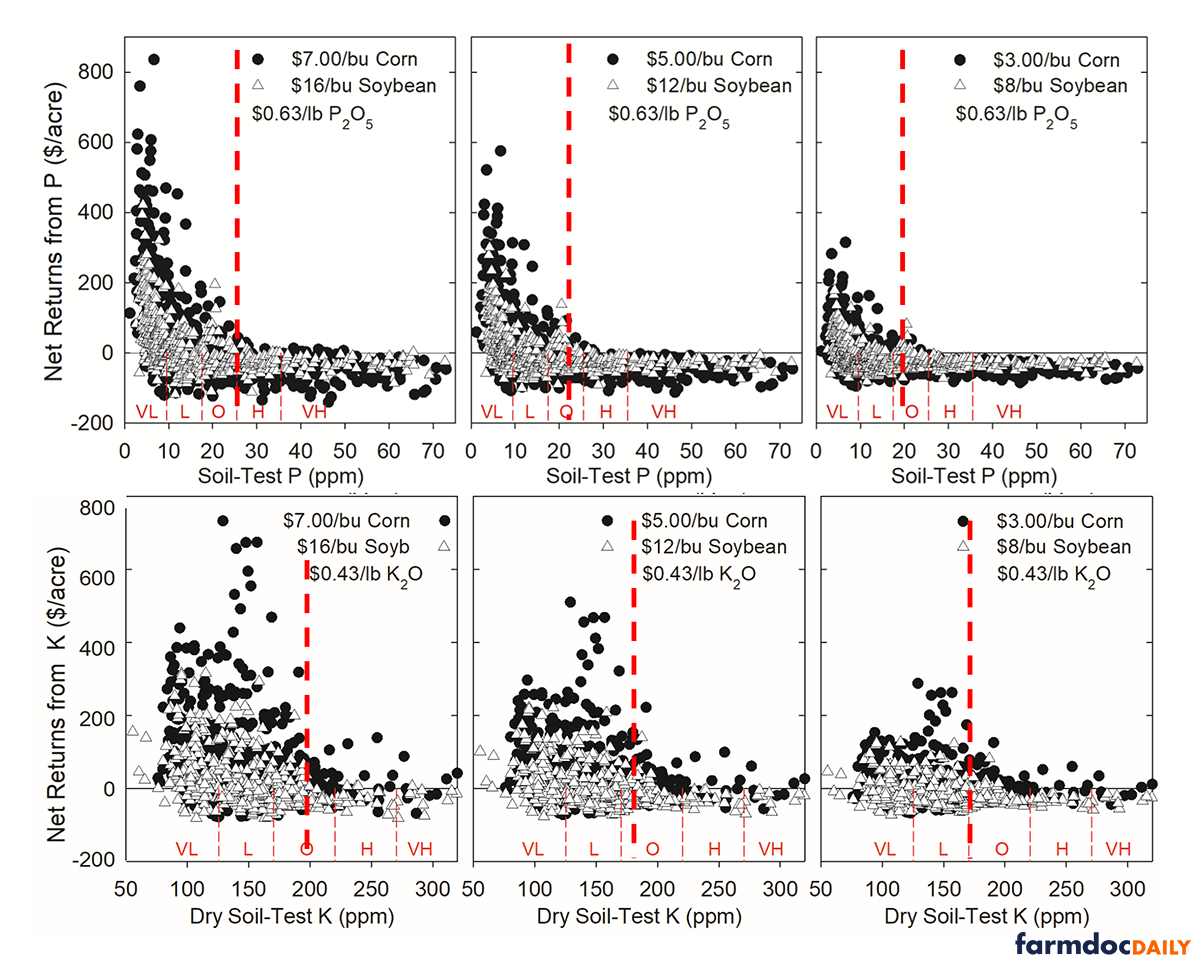
At low crop prices the CSTV threshold lowers, as a greater yield response is needed to generate a return to fertilizer input while high crop prices require less yield response to generate returns. Simply put, in tough economic times (low crop prices, high input prices) only highly responsive soils to P and K applications (very low soil test values) will generate a net return to P and K, while less responsive soils (higher soil test levels) are likely to only generate returns in more generous economic environments (high crop prices, low input prices). Research to refine CSTV values for Illinois agriculture is ongoing, including a statewide Illinois NREC-funded on-farm project, but additional opportunities exist to tailor these recommendations to economic considerations and to specific regions or soil types of the state.
Discussion and Guidance
Economical management of P and K in Illinois agricultural systems is not as simple as it may seem – and this presents opportunities for increasing profitability. When asking “where can I cut back?”, consider that there may be ample room for agronomically sound and economically sensible reconsideration of P and K management. Soil tests are a useful tool to determine the likelihood of a crop yield response to P and K application, but are limited otherwise and blunt, “off-label” tools for the precision needed to maximize economic returns. Current CSTV recommendations do not consider economics, and increased yields may not pay for the fertilizer bill in some cases. The range in grain concentrations of P and K within and across fields presents ample opportunity for precision P and K management best achieved by grain testing, not soil testing. The appreciable economic returns of this approach merit consideration of the crop and nutrient, however. Fields under a maintenance or drawdown strategy may be better served by grain testing to determine actual P and K nutrient removal than rely solely on assumed grain nutrient coefficients. Grain samples can be submitted to almost any commercial laboratory.
Based on the results of grain testing, the percentage of elemental P or K reported by the lab (i.e., % of grain weight on a 0% moisture basis) can be converted into oxide form (multiply by 2.29 for P to P2O5 and 1.2 for K to K2O), corrected for target moisture (15.5% corn and 13% soybeans), and multiplied by bushel weight (56lbs for corn, 60 for soybeans) to determine nutrient removal. An example calculation:

For those interested in grain testing, here is a simple tool to calculate grain nutrient concentrations (lb P2O5 or K2O/bu) from laboratory results and evaluate potential fertilizer cost savings based on the different from current Agronomy Handbook recommendations.
Below are additional and specific considerations going into this fall to improve your P and K management strategy and improve the farm’s bottom line:
- Evaluate economic outcomes when fertilizing fields with soil test values under the CSTV: 20-25 ppm for P, and 130-150 ppm K*. Leave an unfertilized or reduced rate check strip to evaluate return in 2027, also consider pulling soil samples before application and after harvest instead of your usual sampling rotation to evaluate change in soil test values after fertilization and crop removal for on your own farm. To gauge important sources of variation in soil test values, consider pulling soils at a few timepoints over the post-harvest period, and send the same sample (labeled differently) to the same soil testing lab. This will give you a sense of how much values vary due to sampling time (soil moisture, residue decomposition, etc) and lab procedures, to avoid confusing an apparent change with a ‘real’ change in the soil test values.
- Consider refining maintenance applications by considering grain removal rather than the off-label use of soil tests. The grain removal coefficients can be adjusted or – better yet – invest the dollars that would be used for soil testing in grain nutrient content to calculate exact P and K removal for a given field.
- Consider the historic “surplus” (fertility applied over required maintenance) on applicable acres. This may be fields with soil test in the “drawdown range, >30-35 ppm P and >180-200 ppm K* and could be a good time to skip or reduce a maintenance application rate based on past history and soil test values. Alternative fertilization methods such as banding (strip or starter) may help improve efficiency in partial drawdown.
*Quickly convert ppm to lbs/ac by multiplying ppm value by 2
References
Mallarino, A. (2026, March 26). Phosphorus and Potassium Management with High and Uncertain Prices This Spring. Iowa State University, Extension and Outreach. Integrated Crop Management. https://crops.extension.iastate.edu/cropnews/2026/03/phosphorus-and-potassium-management-high-and-uncertain-prices-spring
Villamil, M. B., Nafziger, E. D., & Behnke, G. D. (2019). New Grain P and K Concentration Values for Illinois Field Crops. Crop, Forage & Turfgrass Management, 5(1), 180090. https://doi.org/10.2134/cftm2018.11.0090
Bergschneider, L. and A. Margenot. "Rethinking Phosphorus and Potassium, Part 1: Soil Testing 101." farmdoc daily (16):113, Department of Agricultural and Consumer Economics, University of Illinois at Urbana-Champaign, June 29, 2026.
Bergschneider, L., Y. Freiberg and A. Margenot. "Rethinking Phosphorus and Potassium, Part 2: Grain Removal Values." farmdoc daily (16):132, Department of Agricultural and Consumer Economics, University of Illinois at Urbana-Champaign, July 27, 2026.
Paulson, N., G. Schnitkey, C. Zulauf and B. Zwilling. "Spring Revision to 2026 Illinois Crop Budgets." farmdoc daily (16):88, Department of Agricultural and Consumer Economics, University of Illinois at Urbana-Champaign, May 19, 2026.
Disclaimer: We request all readers, electronic media and others follow our citation guidelines when re-posting articles from farmdoc daily. Guidelines are available here. The farmdoc daily website falls under University of Illinois copyright and intellectual property rights. For a detailed statement, please see the University of Illinois Copyright Information and Policies here.