








Rethinking Phosphorus and Potassium, Part 2: Grain Removal Values
Soil Testing Strategies
As discussed in part 1 of this series (see farmdoc daily article from June 29, 2026), grain removal rates are foundational to phosphorus (P) and potassium (K) management. While critical soil test values (CSTV) are utilized to evaluate yield or profitability response probability (“when should I apply?”), the question of “how much” to apply is a related but distinct question. If we step back, “how much” to apply is predicated on P and K removal rates regardless of management strategy. Removal rate is the amount of P and K removed from a field (lb/ac) with grain harvest, based on the amount of P and K in each bushel of grain and yield (pounds P or K per bushel of grain x bushels per acre yield = pounds P or K removed via grain per acre). Whether one seeks to “build” soil test values to get to the CSTV, “maintain” soil test values when above the CSTV, or to “drawdown” on soil test values that far exceed the CSTV, all three strategies are predicated on the amount of P and K removed with crop harvest.
Applying based on the amount (lb/ac) of nutrients removed with grain at harvest in some sense implies 100% nutrient use efficiency: all nutrients utilized by the crop are resupplied to the agronomic system. While these nutrients are not necessarily utilized by the crop in the same year as application, a 1:1 replacement-removal approach should maintain soil P and K reserves in the long-term. Likewise, a “build” strategy with a hypothetical 1.5:1 replacement-removal ratio (50% more nutrient added on top of replacing removal) should increase soil P and K reserves in the long-term. In contrast, a drawdown approach such as a 0.75:1 replacement-removal ratio should decrease levels over time by inducing a 25% removal deficit. In all three strategies, knowing how much P and K was removed from the field with grain at harvest is needed to dial in maintenance (equal to removal), build-up (above removal) and drawdown (below removal).
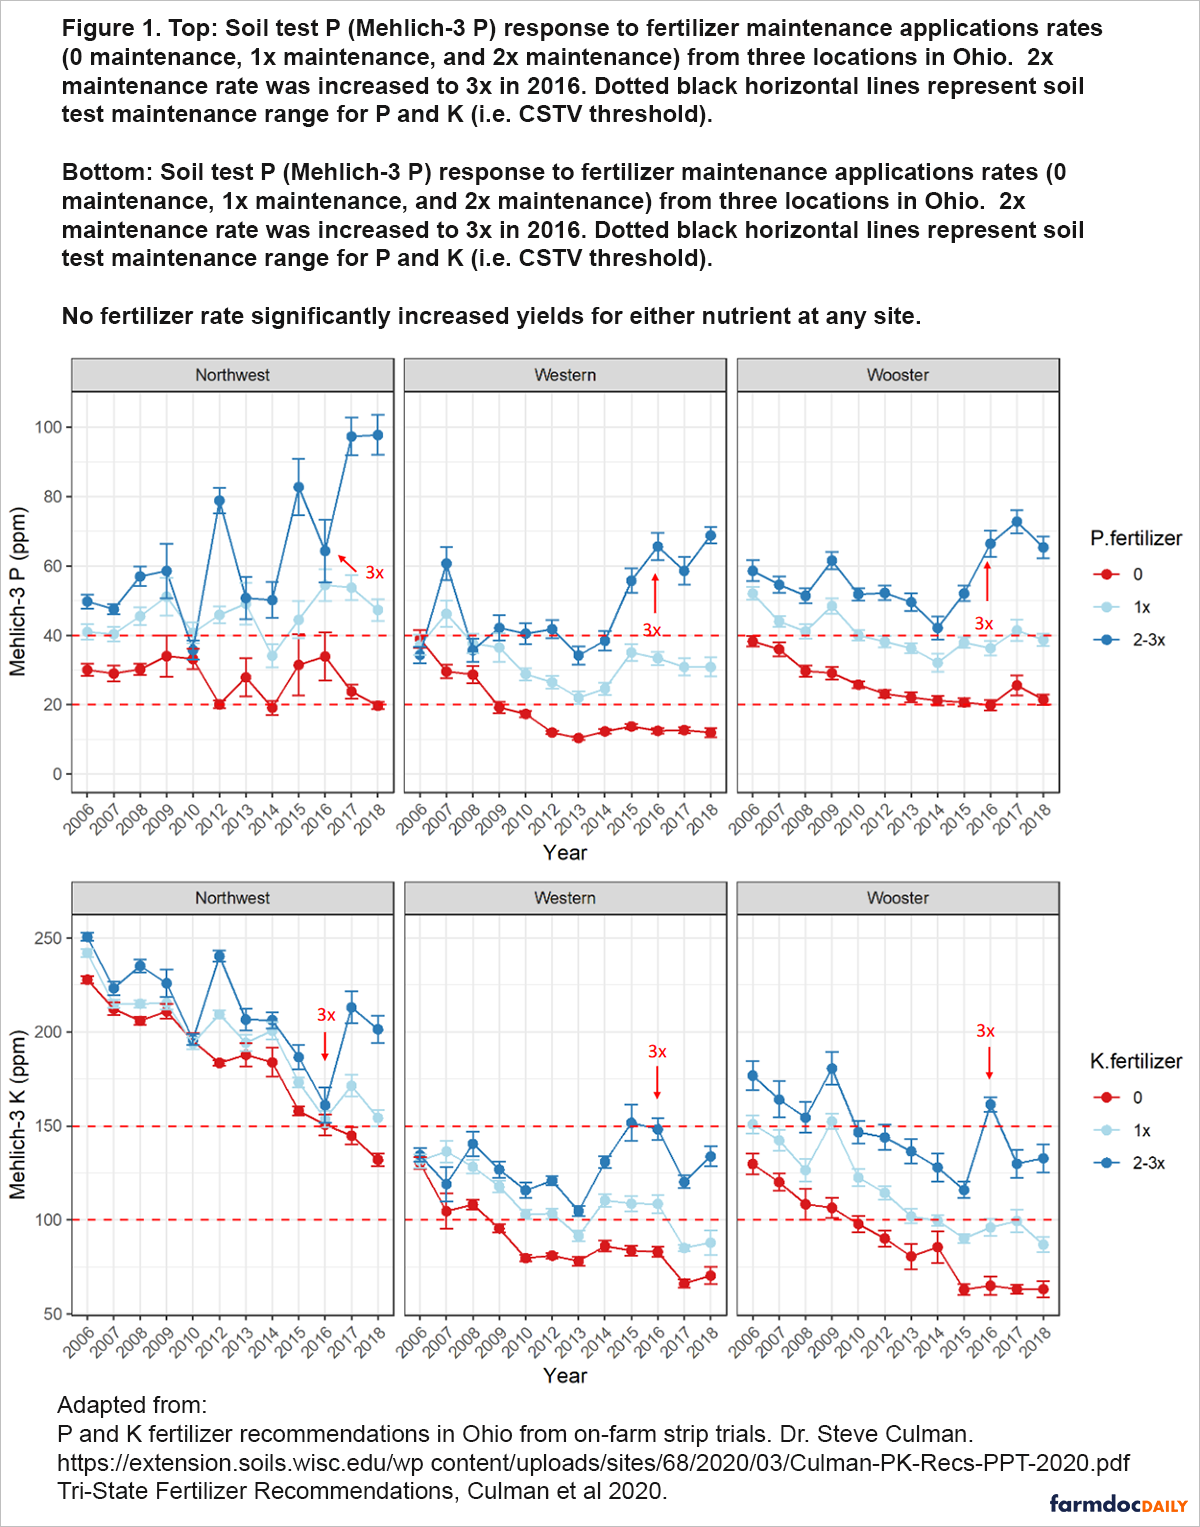
However, despite expected relationships between fertility strategy and soil test values, these assumptions do not necessarily hold true in the field. The figure below illustrates relationships between P and K fertilizer rates based on grain removal (0x, 1x and 2-3x maintenance) and soil test P and K values over 9 years at three locations in Ohio (Fulford & Culman, 2018). While soil test P and K values are lower at 0x maintenance than 1x or 2-3x, test values do not drop linearly over time as would be expected with continued grain P and K removal. Conversely, the build rate of 2-3x of maintenance does not necessarily increase soil test levels steadily for P, and soil test K levels actually drop. At the maintenance rate (1x), we see substantial fluctuations for P, and declines in soil test K. Because soil test P and K values do not reflect this wide range of application rates based on drawdown (0x), maintenance (1x), and build (2-3x), this long-term dataset is powerful in illustrating that soil tests are very imperfect tools for tracking how much P and K leaves the agronomic system with grain at harvest and how much P and K enters the system with applications.
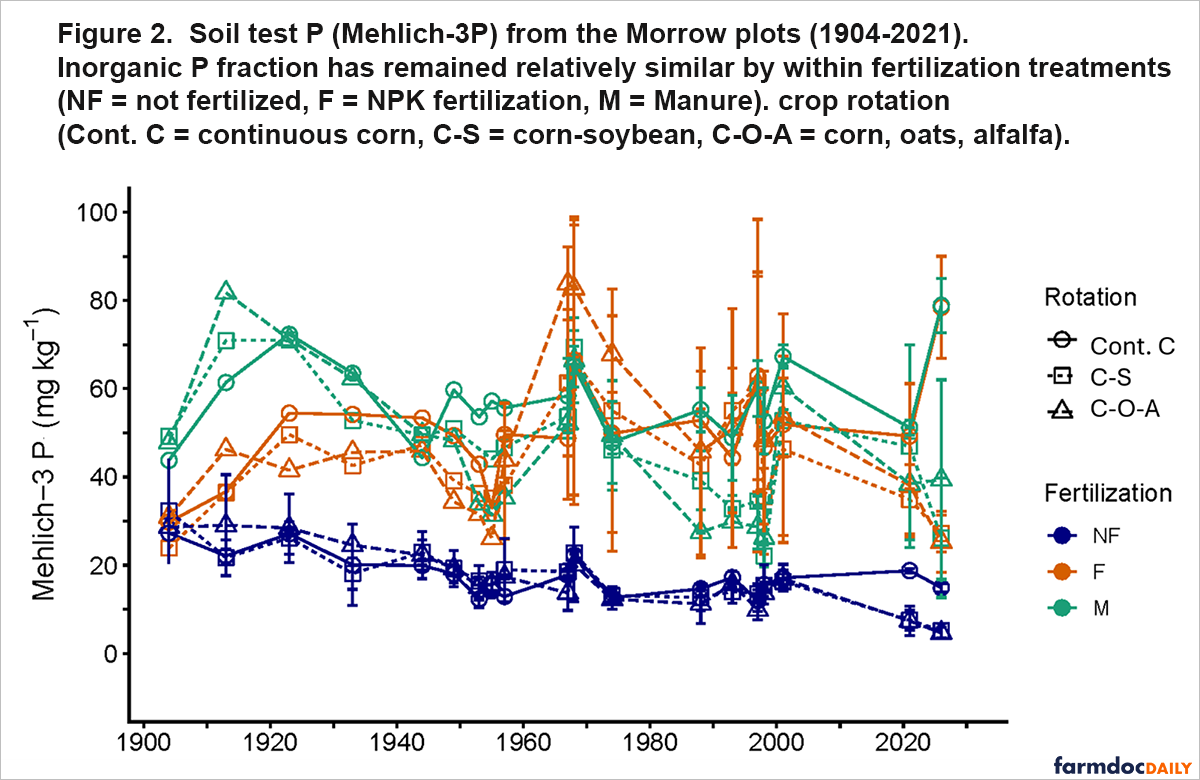
Going even longer-term, at the Morrow Plots (est. 1876) on the University of Illinois campus we find that soil test P declines very gradually without P fertilization over the 20th century, from 30 mg/kg to 15 mg/kg. To be fair, no P fertilization also does not include N or K, so N-limited yields (25-150 bu/ac depending on crop rotation) entail lower P removal rates with harvest. Still, it is clear that soil test P does not reflect P removal with grain harvest over a range of time scales (10 to 100 years). To put it differently: in the major soil types of the Midwest (Mollisols and Alfisols, or prairie and timber soils), we generally do not see rapid increases or decreases in soil test P and K with or without application.
Why Focus on Grain Removal Rates?
As highlighted above, soil test is a poor tool (“off-label”) to track nutrient export from a field. Even if soil tests are below CSTV for yield response probability, fertilizer application may not be economically viable (probability of net positive $/ac). However, this nutrient balance (nutrient import – nutrient export) needs to be monitored to ensure future yields are not limited. Grain removal rates have long been used in Illinois to ensure soil fertility levels are preserved. Research from Dr. Hopkins in the early 1900s indicates harvest index and grain P removal rates similar to our modern values over a century later (0.39 lb P2O5/bu vs modern 0.37 lb P2O5/bu) (Hopkins, 1908). These values are an early example of reference values (“book” values or “removal coefficients”) utilized to simplify yield-based removal rate calculations. While some state recommendations have decreased concentrations slightly in recent decades, values have largely remained similar.
Illinois reference values were recently (2017) updated as a result of Illinois NREC funded research to reflect modern genetics and management practices (Nafziger, 2017; Villamil et al., 2019). However, there are a few important considerations when referencing the “book” values. Reference grain values have not shifted significantly despite dramatic increases in yields over the past century (see farmdoc daily article from April 28, 2026). Grain nutrient concentrations also tend to remain consistent regardless of yield (no yield driven changes in grain nutrient concentration), instead total removal rates tend to scale linearly with yield (more yield results in more removal). Finally, while “book” values are reported and utilized as a single concentration, these values are often selected from a distribution of values. The variability within this distribution easily surpasses the lowering in values from recent grain removal updates, highlighting variability in grain nutrient concentrations.
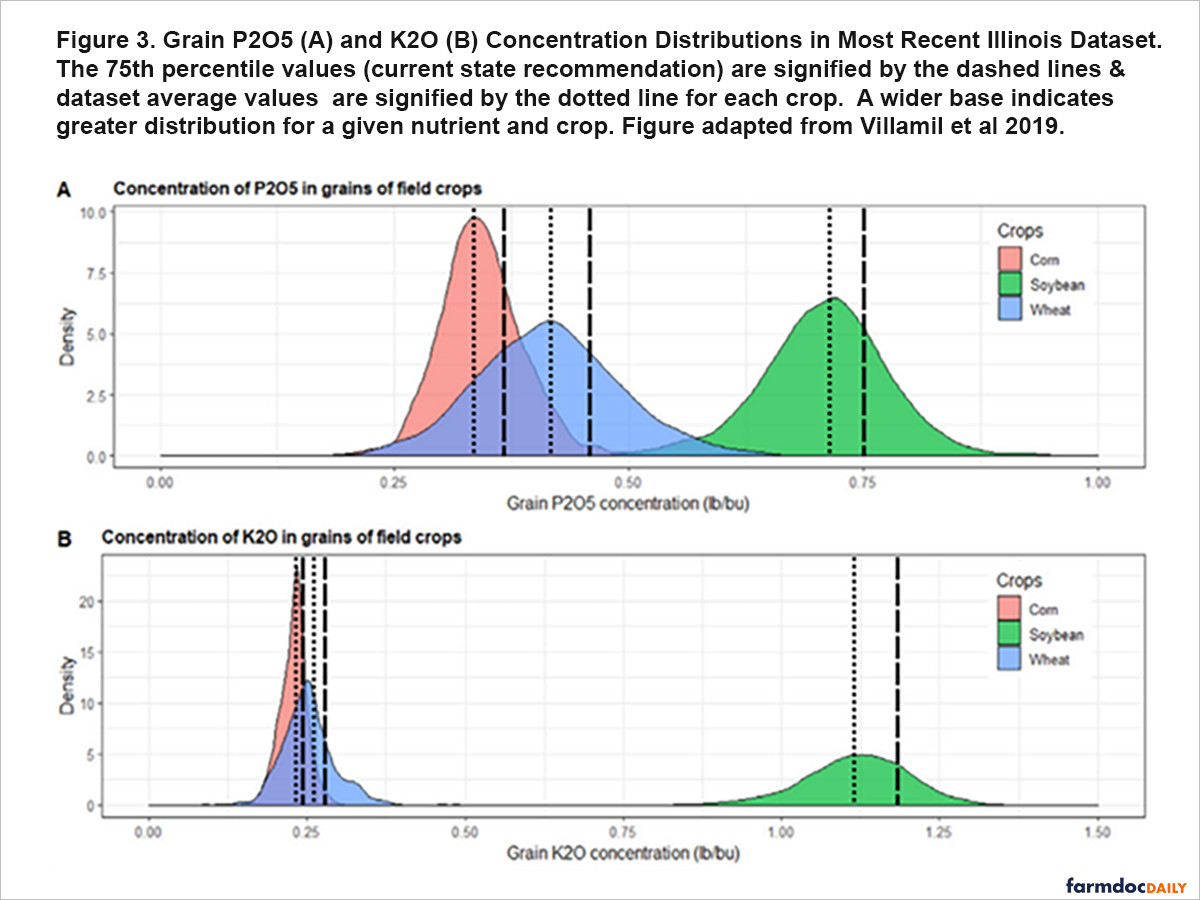
For example, grain K2O* concentrations tend to vary the least for corn and wheat compared to soybeans, while P2O5* concentrations for soybeans and wheat tend to vary more than corn (Villamil et al., 2019). How and why these concentrations vary are not well understood, but likely reflects crop specifies-specific physiology. On-going research by the authors and farmer and industry collaborators seeks to identify major sources of variability of grain P and K, in particular genetics, soil type and test values, and weather.
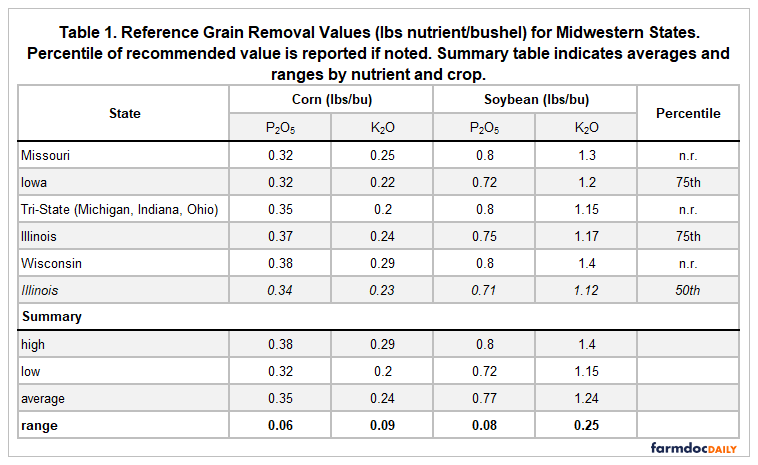
The variability within a given grain removal dataset is also represented in the variation in grain removal coefficients among Midwestern states. First, note that the “averages” are not in fact averages (50th percentile) of grain P and K content in many state recommendations: 75th percentile values recommended in states such as Illinois and Iowa by definition means that grain P and K removal is overestimated for 3 of 4 grain samples. The degree to which “book” values over or underestimate removal depends on the specific field’s grain P and K concentration relative to the distribution of grain values used to establish state recommendations.
Implications
These assumed or reference values for grain removal are clearly useful, and have helped refine P and K management. However, there is a missed opportunity to fine-tune P and K management by considering the variability that may underlie these “average” values. Consider both the annual economic impact and the management implications of not actually knowing the true P and K removal rate. When the assumed P and K removal is higher than actual removal, a maintenance application is actually a build application, and a drawdown application is actually a maintenance (or build) rate application.
Rather than assuming removal of P and K with grain harvest, why not simply measure it? As we’ve discussed, soil tests are useful for understanding the probability of crop yield response (or net return) and thus when to apply – but knowing how much to apply is a separate question. Assuming the planter is properly calibrated without doing stand counts would be highly risky; why take the same approach with fertility testing? Substantial opportunities to improve precision management of P and K exist, especially for those utilizing VRT applications. If one is already accounting for sub-field variability in fertility applications, wouldn’t it be wise to consider the same variability in grain nutrient concentrations?
An additional benefit to tracking grain removal rates is the ability to fluidly manage maintenance P and K applications. By definition, maintenance applications are not critical to next season’s yield and therefore afford flexibility in P and K management. In addition to replacing the exact amount of P and K removed in a given year, we can replace the exact amount removed in years past. In times of high input prices, this approach may pay dividends to capitalize on lower fertilizer price years and sit out in higher price years. In years with low margins this approach may prove to be an economical and agronomically sound strategy for long-term sustainability. Grain testing is likely offered by your soil and/or foliar testing lab, as the chemistry is the same. Our recent proposition on grain testing has high support from commercial labs, as showcased in this recent Agricultural Laboratory Testing Association (ALTA) webinar.
Summary
Crop removal of P and K is essential to build, maintain and drawdown strategies. However, soil tests do not accurately reflect P and K rates with grain harvest, and assumed removal values coefficients gloss over substantial variability that can lead to a particular farm overestimating or underestimating the actual P and K removal with harvest. These discrepancies may seem small on a per-bushel basis but can add up to be economically and agronomically significant over time. Grain-based testing offers a means to identify the actual P and K removal rate for maximizing economic returns.
The final part of this series will focus on maximizing economic returns to P and K through grain-based testing, using examples from on-farm research sites. When does it pay to ensure P and K levels are not yield-limiting by building to the CSTV, and how can grain-based testing maximize economic returns by reducing “overspending” of unnecessary P and K?
*Despite common usage in agronomy, P2O5 and K2O are molecules that do not exist in soil nor in fertilizer. Naming based on the oxide forms (containing the element oxygen) dates back to the late 1800s, and names have not since been updated. Both oxide forms inflate perceived fertilizer nutrient content relative to elemental forms (2.29 lbs P2O5 to 1 lb P and 1.29 lbs K2O to 1 lb K).
References
Bergschneider, L. and A. Margenot. "Rethinking Phosphorus and Potassium, Part 1: Soil Testing 101." farmdoc daily (16):113, Department of Agricultural and Consumer Economics, University of Illinois at Urbana-Champaign, June 29, 2026.
Culman, S., Fulford, A., Camberato, J., Steinke, K., Lindsey, L., LaBarge, G., Watters, H., Lentz, E., Haden, R., Richer, E., Herman, B., Hoekstra, N., Thomison, P., & Warncke, D. (2020). Tri-State Fertilizer Recommendations.
Fulford, A. M., & Culman, S. W. (2018). Over-Fertilization Does Not Build Soil Test Phosphorus and Potassium in Ohio. Agronomy Journal, 110(1), 56–65. https://doi.org/10.2134/agronj2016.12.0701
Hopkins, C. G. (1908). Phosphorus and humus in relation to Illinois soils. Circular, University of Illinois, Agricultural Experiment Station; No. 116.
Nafziger, E. (2017, September 7). New Grain Phosphorus and Potassium Numbers. Farmdoc. https://farmdoc.illinois.edu/field-crop-production/uncategorized/new-grain-phosphorus-and-potassium-numbers.html
Schnitkey, G., N. Paulson and C. Zulauf. "Yield Increases of Grains and Major Crops in the United States." farmdoc daily (16):74, Department of Agricultural and Consumer Economics, University of Illinois at Urbana-Champaign, April 28, 2026.
Villamil, M. B., Nafziger, E. D., & Behnke, G. D. (2019). New Grain P and K Concentration Values for Illinois Field Crops. Crop, Forage & Turfgrass Management, 5(1), 180090. https://doi.org/10.2134/cftm2018.11.0090
Disclaimer: We request all readers, electronic media and others follow our citation guidelines when re-posting articles from farmdoc daily. Guidelines are available here. The farmdoc daily website falls under University of Illinois copyright and intellectual property rights. For a detailed statement, please see the University of Illinois Copyright Information and Policies here.